Peruvian vs Romanian Female Disability
COMPARE
Peruvian
Romanian
Female Disability
Female Disability Comparison
Peruvians
Romanians
11.3%
FEMALE DISABILITY
99.9/ 100
METRIC RATING
54th/ 347
METRIC RANK
11.9%
FEMALE DISABILITY
91.6/ 100
METRIC RATING
140th/ 347
METRIC RANK
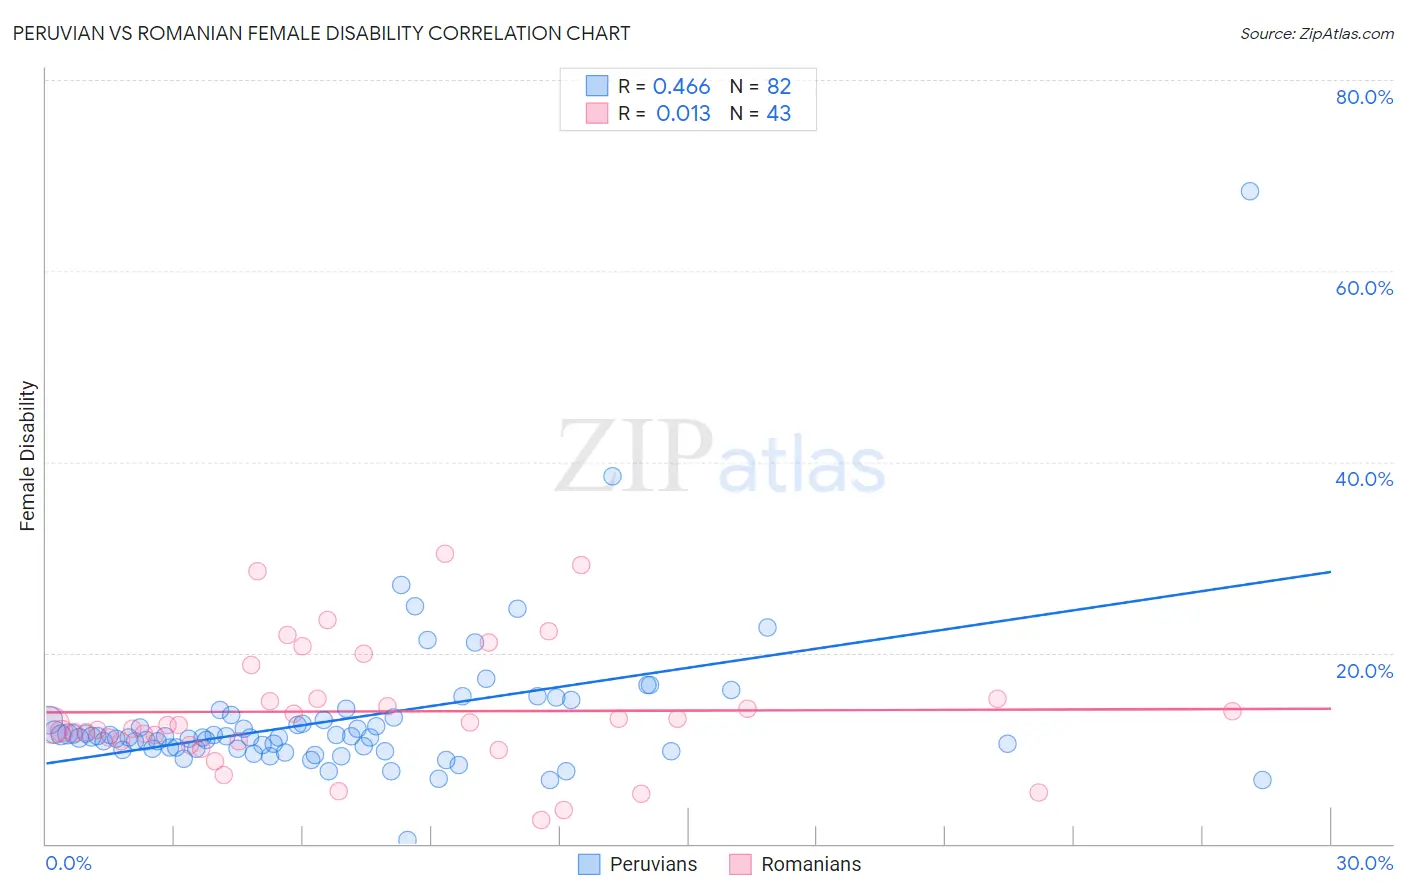
Peruvian vs Romanian Female Disability Correlation Chart
The statistical analysis conducted on geographies consisting of 363,181,047 people shows a moderate positive correlation between the proportion of Peruvians and percentage of females with a disability in the United States with a correlation coefficient (R) of 0.466 and weighted average of 11.3%. Similarly, the statistical analysis conducted on geographies consisting of 377,864,949 people shows no correlation between the proportion of Romanians and percentage of females with a disability in the United States with a correlation coefficient (R) of 0.013 and weighted average of 11.9%, a difference of 5.2%.
Female Disability Correlation Summary
| Measurement | Peruvian | Romanian |
| Minimum | 0.45% | 2.4% |
| Maximum | 68.3% | 30.3% |
| Range | 67.8% | 27.9% |
| Mean | 13.0% | 13.9% |
| Median | 11.2% | 12.5% |
| Interquartile 25% (IQ1) | 9.9% | 10.7% |
| Interquartile 75% (IQ3) | 13.0% | 15.2% |
| Interquartile Range (IQR) | 3.1% | 4.4% |
| Standard Deviation (Sample) | 8.0% | 6.5% |
| Standard Deviation (Population) | 8.0% | 6.4% |
Similar Demographics by Female Disability
Demographics Similar to Peruvians by Female Disability
In terms of female disability, the demographic groups most similar to Peruvians are Bulgarian (11.3%, a difference of 0.020%), Immigrants from Saudi Arabia (11.3%, a difference of 0.060%), Immigrants from Peru (11.3%, a difference of 0.10%), Immigrants from Belgium (11.3%, a difference of 0.22%), and Taiwanese (11.4%, a difference of 0.25%).
| Demographics | Rating | Rank | Female Disability |
| Jordanians | 100.0 /100 | #47 | Exceptional 11.3% |
| Zimbabweans | 100.0 /100 | #48 | Exceptional 11.3% |
| Tongans | 100.0 /100 | #49 | Exceptional 11.3% |
| Inupiat | 100.0 /100 | #50 | Exceptional 11.3% |
| Immigrants | Belgium | 100.0 /100 | #51 | Exceptional 11.3% |
| Immigrants | Peru | 99.9 /100 | #52 | Exceptional 11.3% |
| Immigrants | Saudi Arabia | 99.9 /100 | #53 | Exceptional 11.3% |
| Peruvians | 99.9 /100 | #54 | Exceptional 11.3% |
| Bulgarians | 99.9 /100 | #55 | Exceptional 11.3% |
| Taiwanese | 99.9 /100 | #56 | Exceptional 11.4% |
| South Americans | 99.9 /100 | #57 | Exceptional 11.4% |
| Laotians | 99.9 /100 | #58 | Exceptional 11.4% |
| Immigrants | Spain | 99.9 /100 | #59 | Exceptional 11.4% |
| Immigrants | Bulgaria | 99.9 /100 | #60 | Exceptional 11.4% |
| Immigrants | France | 99.9 /100 | #61 | Exceptional 11.4% |
Demographics Similar to Romanians by Female Disability
In terms of female disability, the demographic groups most similar to Romanians are Immigrants from Ecuador (11.9%, a difference of 0.020%), Immigrants from Hungary (11.9%, a difference of 0.16%), Immigrants from Africa (11.9%, a difference of 0.19%), Immigrants from Sudan (11.9%, a difference of 0.23%), and Ecuadorian (11.9%, a difference of 0.25%).
| Demographics | Rating | Rank | Female Disability |
| Kenyans | 94.5 /100 | #133 | Exceptional 11.9% |
| Immigrants | Nicaragua | 94.5 /100 | #134 | Exceptional 11.9% |
| Central Americans | 94.2 /100 | #135 | Exceptional 11.9% |
| Ugandans | 94.0 /100 | #136 | Exceptional 11.9% |
| Immigrants | Norway | 93.8 /100 | #137 | Exceptional 11.9% |
| Ecuadorians | 93.4 /100 | #138 | Exceptional 11.9% |
| Immigrants | Hungary | 92.8 /100 | #139 | Exceptional 11.9% |
| Romanians | 91.6 /100 | #140 | Exceptional 11.9% |
| Immigrants | Ecuador | 91.5 /100 | #141 | Exceptional 11.9% |
| Immigrants | Africa | 90.0 /100 | #142 | Excellent 11.9% |
| Immigrants | Sudan | 89.6 /100 | #143 | Excellent 11.9% |
| Immigrants | Austria | 87.9 /100 | #144 | Excellent 12.0% |
| Estonians | 87.8 /100 | #145 | Excellent 12.0% |
| Pakistanis | 84.6 /100 | #146 | Excellent 12.0% |
| Nigerians | 84.0 /100 | #147 | Excellent 12.0% |