Marshallese vs Immigrants from Norway Female Disability
COMPARE
Marshallese
Immigrants from Norway
Female Disability
Female Disability Comparison
Marshallese
Immigrants from Norway
13.3%
FEMALE DISABILITY
0.0/ 100
METRIC RATING
293rd/ 347
METRIC RANK
11.9%
FEMALE DISABILITY
93.8/ 100
METRIC RATING
137th/ 347
METRIC RANK
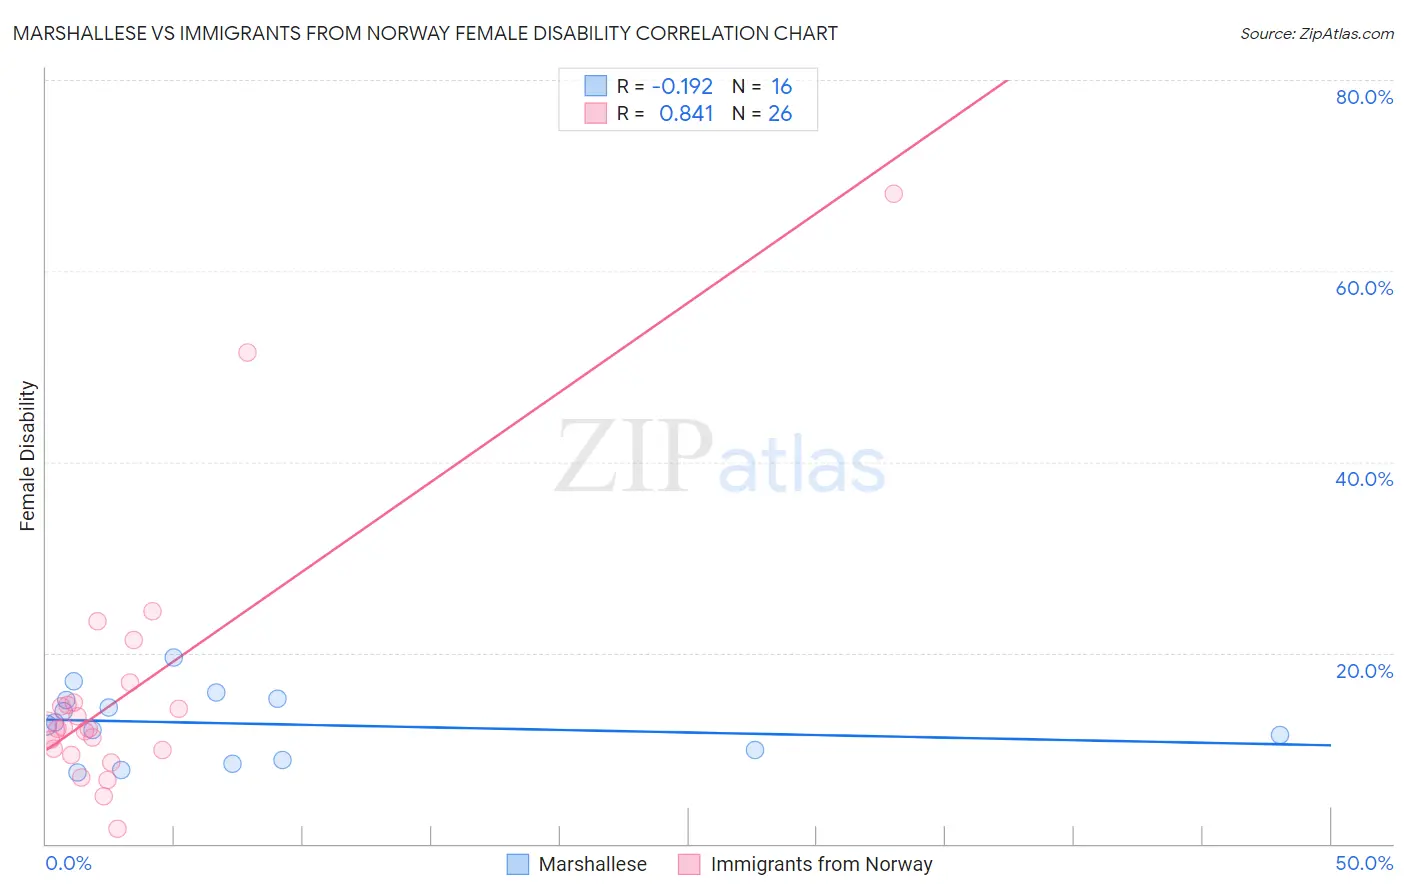
Marshallese vs Immigrants from Norway Female Disability Correlation Chart
The statistical analysis conducted on geographies consisting of 14,761,315 people shows a poor negative correlation between the proportion of Marshallese and percentage of females with a disability in the United States with a correlation coefficient (R) of -0.192 and weighted average of 13.3%. Similarly, the statistical analysis conducted on geographies consisting of 116,702,841 people shows a very strong positive correlation between the proportion of Immigrants from Norway and percentage of females with a disability in the United States with a correlation coefficient (R) of 0.841 and weighted average of 11.9%, a difference of 11.7%.
Female Disability Correlation Summary
| Measurement | Marshallese | Immigrants from Norway |
| Minimum | 7.4% | 1.5% |
| Maximum | 19.5% | 68.1% |
| Range | 12.1% | 66.6% |
| Mean | 12.6% | 16.0% |
| Median | 12.5% | 12.0% |
| Interquartile 25% (IQ1) | 9.3% | 9.8% |
| Interquartile 75% (IQ3) | 15.1% | 14.8% |
| Interquartile Range (IQR) | 5.8% | 5.0% |
| Standard Deviation (Sample) | 3.5% | 14.1% |
| Standard Deviation (Population) | 3.4% | 13.8% |
Similar Demographics by Female Disability
Demographics Similar to Marshallese by Female Disability
In terms of female disability, the demographic groups most similar to Marshallese are Celtic (13.3%, a difference of 0.050%), Yakama (13.2%, a difference of 0.26%), French (13.3%, a difference of 0.26%), Nepalese (13.3%, a difference of 0.39%), and Slovak (13.3%, a difference of 0.42%).
| Demographics | Rating | Rank | Female Disability |
| Fijians | 0.0 /100 | #286 | Tragic 13.1% |
| Yaqui | 0.0 /100 | #287 | Tragic 13.2% |
| Whites/Caucasians | 0.0 /100 | #288 | Tragic 13.2% |
| Tlingit-Haida | 0.0 /100 | #289 | Tragic 13.2% |
| Immigrants | Yemen | 0.0 /100 | #290 | Tragic 13.2% |
| Shoshone | 0.0 /100 | #291 | Tragic 13.2% |
| Yakama | 0.0 /100 | #292 | Tragic 13.2% |
| Marshallese | 0.0 /100 | #293 | Tragic 13.3% |
| Celtics | 0.0 /100 | #294 | Tragic 13.3% |
| French | 0.0 /100 | #295 | Tragic 13.3% |
| Nepalese | 0.0 /100 | #296 | Tragic 13.3% |
| Slovaks | 0.0 /100 | #297 | Tragic 13.3% |
| Immigrants | Nonimmigrants | 0.0 /100 | #298 | Tragic 13.4% |
| Immigrants | Dominican Republic | 0.0 /100 | #299 | Tragic 13.4% |
| Pennsylvania Germans | 0.0 /100 | #300 | Tragic 13.4% |
Demographics Similar to Immigrants from Norway by Female Disability
In terms of female disability, the demographic groups most similar to Immigrants from Norway are Ugandan (11.9%, a difference of 0.040%), Central American (11.9%, a difference of 0.060%), Ecuadorian (11.9%, a difference of 0.060%), Kenyan (11.9%, a difference of 0.13%), and Immigrants from Nicaragua (11.9%, a difference of 0.13%).
| Demographics | Rating | Rank | Female Disability |
| Nicaraguans | 95.2 /100 | #130 | Exceptional 11.9% |
| Arabs | 95.1 /100 | #131 | Exceptional 11.9% |
| Immigrants | Syria | 94.6 /100 | #132 | Exceptional 11.9% |
| Kenyans | 94.5 /100 | #133 | Exceptional 11.9% |
| Immigrants | Nicaragua | 94.5 /100 | #134 | Exceptional 11.9% |
| Central Americans | 94.2 /100 | #135 | Exceptional 11.9% |
| Ugandans | 94.0 /100 | #136 | Exceptional 11.9% |
| Immigrants | Norway | 93.8 /100 | #137 | Exceptional 11.9% |
| Ecuadorians | 93.4 /100 | #138 | Exceptional 11.9% |
| Immigrants | Hungary | 92.8 /100 | #139 | Exceptional 11.9% |
| Romanians | 91.6 /100 | #140 | Exceptional 11.9% |
| Immigrants | Ecuador | 91.5 /100 | #141 | Exceptional 11.9% |
| Immigrants | Africa | 90.0 /100 | #142 | Excellent 11.9% |
| Immigrants | Sudan | 89.6 /100 | #143 | Excellent 11.9% |
| Immigrants | Austria | 87.9 /100 | #144 | Excellent 12.0% |