Cherokee vs Immigrants from Norway Female Disability
COMPARE
Cherokee
Immigrants from Norway
Female Disability
Female Disability Comparison
Cherokee
Immigrants from Norway
14.9%
FEMALE DISABILITY
0.0/ 100
METRIC RATING
334th/ 347
METRIC RANK
11.9%
FEMALE DISABILITY
93.8/ 100
METRIC RATING
137th/ 347
METRIC RANK
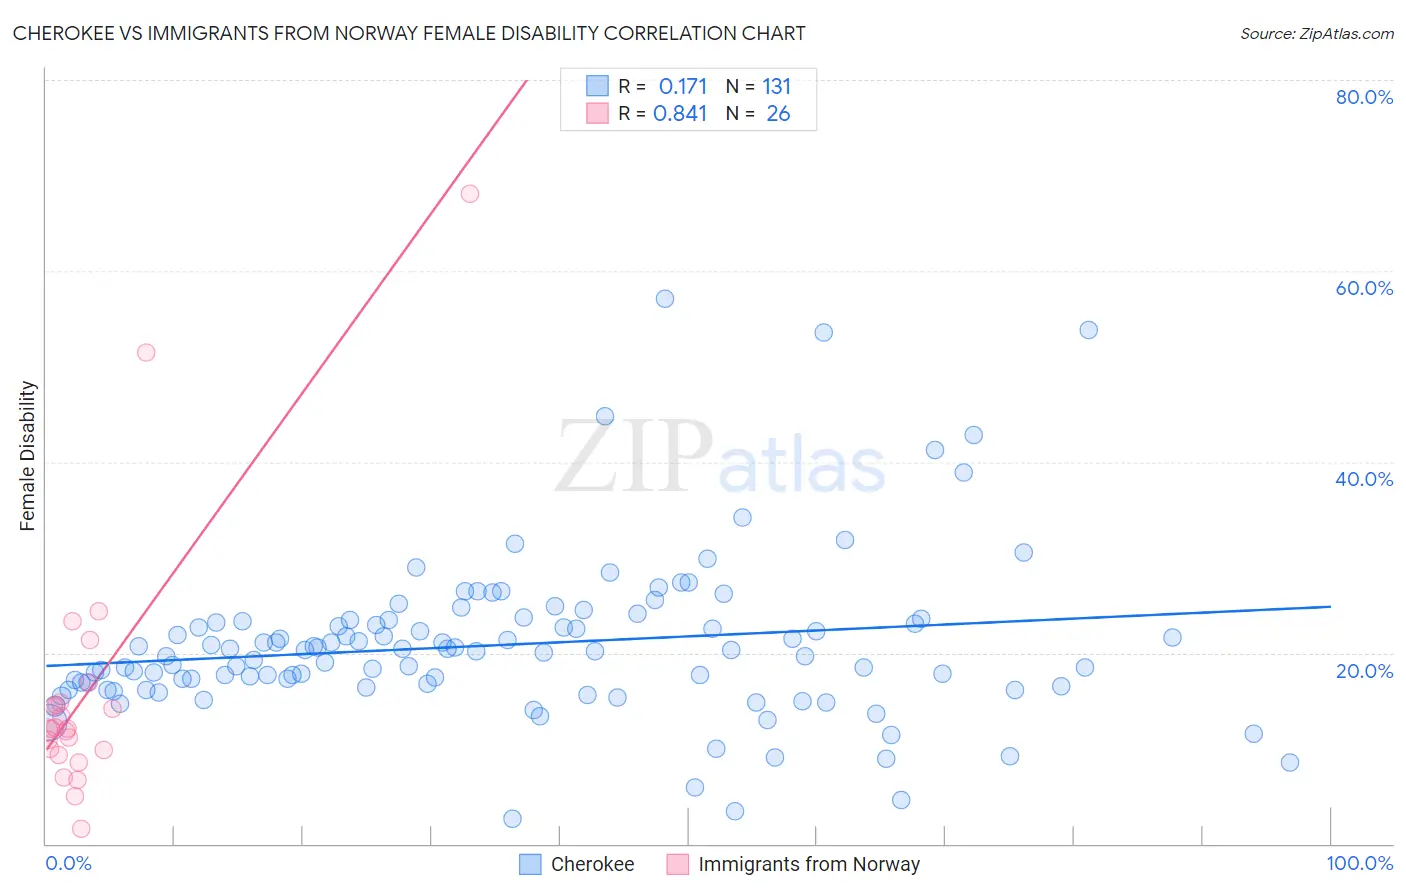
Cherokee vs Immigrants from Norway Female Disability Correlation Chart
The statistical analysis conducted on geographies consisting of 493,548,902 people shows a poor positive correlation between the proportion of Cherokee and percentage of females with a disability in the United States with a correlation coefficient (R) of 0.171 and weighted average of 14.9%. Similarly, the statistical analysis conducted on geographies consisting of 116,702,841 people shows a very strong positive correlation between the proportion of Immigrants from Norway and percentage of females with a disability in the United States with a correlation coefficient (R) of 0.841 and weighted average of 11.9%, a difference of 25.1%.
Female Disability Correlation Summary
| Measurement | Cherokee | Immigrants from Norway |
| Minimum | 2.6% | 1.5% |
| Maximum | 57.1% | 68.1% |
| Range | 54.6% | 66.6% |
| Mean | 20.9% | 16.0% |
| Median | 20.2% | 12.0% |
| Interquartile 25% (IQ1) | 16.5% | 9.8% |
| Interquartile 75% (IQ3) | 23.3% | 14.8% |
| Interquartile Range (IQR) | 6.8% | 5.0% |
| Standard Deviation (Sample) | 8.5% | 14.1% |
| Standard Deviation (Population) | 8.5% | 13.8% |
Similar Demographics by Female Disability
Demographics Similar to Cherokee by Female Disability
In terms of female disability, the demographic groups most similar to Cherokee are Cajun (14.9%, a difference of 0.020%), Immigrants from the Azores (14.9%, a difference of 0.090%), Pima (14.8%, a difference of 0.48%), Seminole (15.0%, a difference of 0.69%), and Tohono O'odham (15.0%, a difference of 0.82%).
| Demographics | Rating | Rank | Female Disability |
| Ottawa | 0.0 /100 | #327 | Tragic 14.2% |
| Cape Verdeans | 0.0 /100 | #328 | Tragic 14.2% |
| Osage | 0.0 /100 | #329 | Tragic 14.3% |
| Yuman | 0.0 /100 | #330 | Tragic 14.5% |
| Immigrants | Cabo Verde | 0.0 /100 | #331 | Tragic 14.6% |
| Pima | 0.0 /100 | #332 | Tragic 14.8% |
| Immigrants | Azores | 0.0 /100 | #333 | Tragic 14.9% |
| Cherokee | 0.0 /100 | #334 | Tragic 14.9% |
| Cajuns | 0.0 /100 | #335 | Tragic 14.9% |
| Seminole | 0.0 /100 | #336 | Tragic 15.0% |
| Tohono O'odham | 0.0 /100 | #337 | Tragic 15.0% |
| Dutch West Indians | 0.0 /100 | #338 | Tragic 15.0% |
| Colville | 0.0 /100 | #339 | Tragic 15.1% |
| Chickasaw | 0.0 /100 | #340 | Tragic 15.2% |
| Choctaw | 0.0 /100 | #341 | Tragic 15.4% |
Demographics Similar to Immigrants from Norway by Female Disability
In terms of female disability, the demographic groups most similar to Immigrants from Norway are Ugandan (11.9%, a difference of 0.040%), Central American (11.9%, a difference of 0.060%), Ecuadorian (11.9%, a difference of 0.060%), Kenyan (11.9%, a difference of 0.13%), and Immigrants from Nicaragua (11.9%, a difference of 0.13%).
| Demographics | Rating | Rank | Female Disability |
| Nicaraguans | 95.2 /100 | #130 | Exceptional 11.9% |
| Arabs | 95.1 /100 | #131 | Exceptional 11.9% |
| Immigrants | Syria | 94.6 /100 | #132 | Exceptional 11.9% |
| Kenyans | 94.5 /100 | #133 | Exceptional 11.9% |
| Immigrants | Nicaragua | 94.5 /100 | #134 | Exceptional 11.9% |
| Central Americans | 94.2 /100 | #135 | Exceptional 11.9% |
| Ugandans | 94.0 /100 | #136 | Exceptional 11.9% |
| Immigrants | Norway | 93.8 /100 | #137 | Exceptional 11.9% |
| Ecuadorians | 93.4 /100 | #138 | Exceptional 11.9% |
| Immigrants | Hungary | 92.8 /100 | #139 | Exceptional 11.9% |
| Romanians | 91.6 /100 | #140 | Exceptional 11.9% |
| Immigrants | Ecuador | 91.5 /100 | #141 | Exceptional 11.9% |
| Immigrants | Africa | 90.0 /100 | #142 | Excellent 11.9% |
| Immigrants | Sudan | 89.6 /100 | #143 | Excellent 11.9% |
| Immigrants | Austria | 87.9 /100 | #144 | Excellent 12.0% |