Immigrants from Liberia vs Immigrants from Thailand Self-Care Disability
COMPARE
Immigrants from Liberia
Immigrants from Thailand
Self-Care Disability
Self-Care Disability Comparison
Immigrants from Liberia
Immigrants from Thailand
2.6%
SELF-CARE DISABILITY
0.4/ 100
METRIC RATING
251st/ 347
METRIC RANK
2.6%
SELF-CARE DISABILITY
4.5/ 100
METRIC RATING
215th/ 347
METRIC RANK
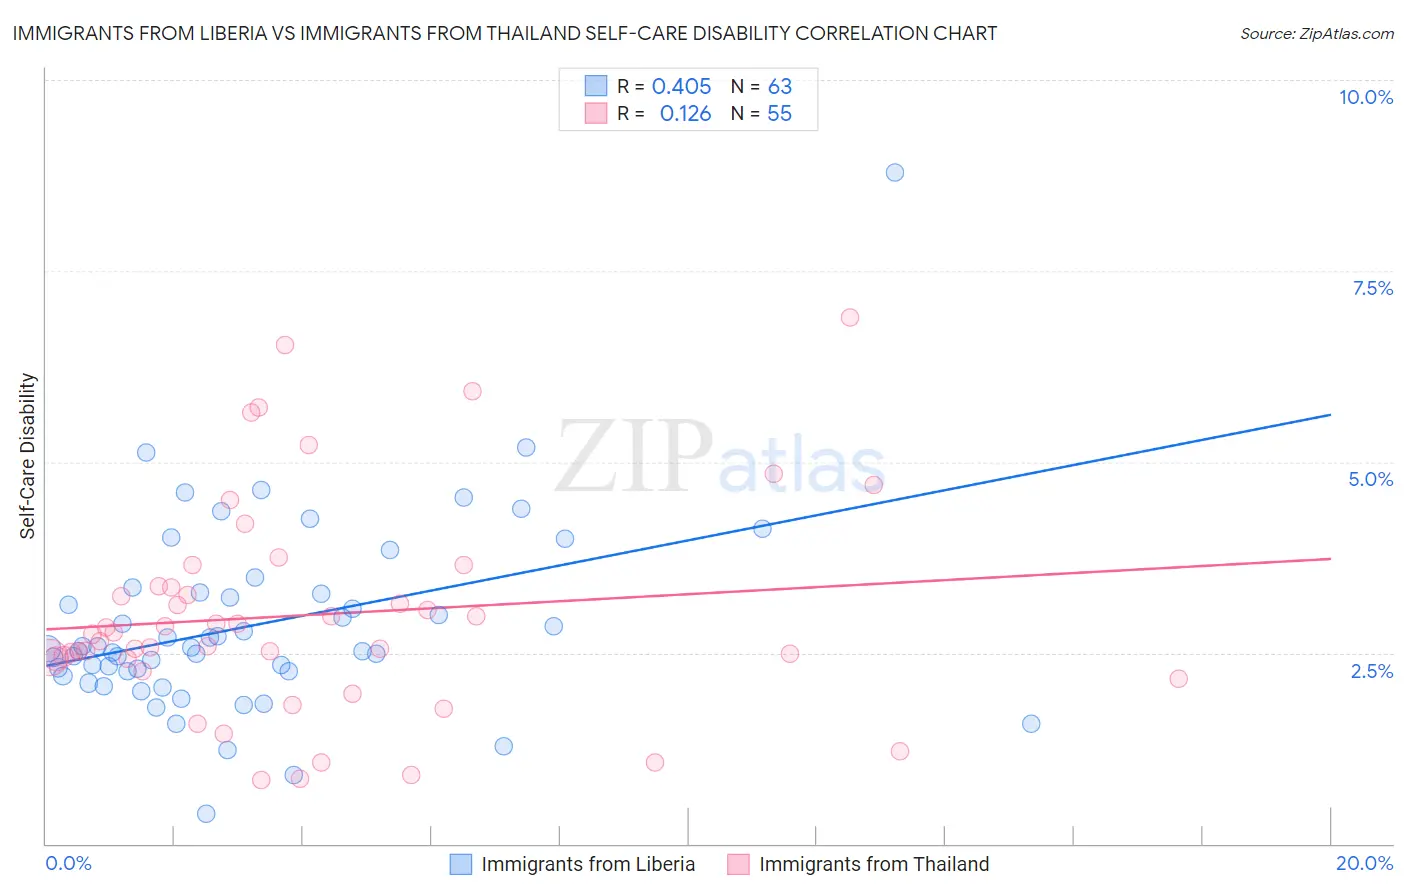
Immigrants from Liberia vs Immigrants from Thailand Self-Care Disability Correlation Chart
The statistical analysis conducted on geographies consisting of 135,176,274 people shows a moderate positive correlation between the proportion of Immigrants from Liberia and percentage of population with self-care disability in the United States with a correlation coefficient (R) of 0.405 and weighted average of 2.6%. Similarly, the statistical analysis conducted on geographies consisting of 316,791,227 people shows a poor positive correlation between the proportion of Immigrants from Thailand and percentage of population with self-care disability in the United States with a correlation coefficient (R) of 0.126 and weighted average of 2.6%, a difference of 2.8%.
Self-Care Disability Correlation Summary
| Measurement | Immigrants from Liberia | Immigrants from Thailand |
| Minimum | 0.40% | 0.83% |
| Maximum | 8.8% | 6.9% |
| Range | 8.4% | 6.1% |
| Mean | 2.9% | 3.0% |
| Median | 2.6% | 2.7% |
| Interquartile 25% (IQ1) | 2.3% | 2.4% |
| Interquartile 75% (IQ3) | 3.3% | 3.4% |
| Interquartile Range (IQR) | 1.0% | 0.94% |
| Standard Deviation (Sample) | 1.3% | 1.4% |
| Standard Deviation (Population) | 1.2% | 1.4% |
Similar Demographics by Self-Care Disability
Demographics Similar to Immigrants from Liberia by Self-Care Disability
In terms of self-care disability, the demographic groups most similar to Immigrants from Liberia are Immigrants from Bangladesh (2.6%, a difference of 0.070%), Portuguese (2.6%, a difference of 0.080%), Immigrants from Haiti (2.6%, a difference of 0.15%), Mexican American Indian (2.6%, a difference of 0.16%), and Haitian (2.6%, a difference of 0.17%).
| Demographics | Rating | Rank | Self-Care Disability |
| Yuman | 0.8 /100 | #244 | Tragic 2.6% |
| Immigrants | Western Asia | 0.6 /100 | #245 | Tragic 2.6% |
| Cheyenne | 0.6 /100 | #246 | Tragic 2.6% |
| Immigrants | Albania | 0.6 /100 | #247 | Tragic 2.6% |
| Nicaraguans | 0.6 /100 | #248 | Tragic 2.6% |
| Mexican American Indians | 0.5 /100 | #249 | Tragic 2.6% |
| Portuguese | 0.4 /100 | #250 | Tragic 2.6% |
| Immigrants | Liberia | 0.4 /100 | #251 | Tragic 2.6% |
| Immigrants | Bangladesh | 0.4 /100 | #252 | Tragic 2.6% |
| Immigrants | Haiti | 0.3 /100 | #253 | Tragic 2.6% |
| Haitians | 0.3 /100 | #254 | Tragic 2.6% |
| Tsimshian | 0.3 /100 | #255 | Tragic 2.6% |
| Immigrants | Central America | 0.3 /100 | #256 | Tragic 2.6% |
| Potawatomi | 0.3 /100 | #257 | Tragic 2.6% |
| Immigrants | Nonimmigrants | 0.3 /100 | #258 | Tragic 2.6% |
Demographics Similar to Immigrants from Thailand by Self-Care Disability
In terms of self-care disability, the demographic groups most similar to Immigrants from Thailand are White/Caucasian (2.6%, a difference of 0.020%), Immigrants from Honduras (2.6%, a difference of 0.040%), Celtic (2.6%, a difference of 0.040%), Ecuadorian (2.6%, a difference of 0.050%), and Scotch-Irish (2.6%, a difference of 0.11%).
| Demographics | Rating | Rank | Self-Care Disability |
| Central Americans | 8.7 /100 | #208 | Tragic 2.5% |
| Malaysians | 7.7 /100 | #209 | Tragic 2.5% |
| Panamanians | 6.4 /100 | #210 | Tragic 2.5% |
| Native Hawaiians | 5.1 /100 | #211 | Tragic 2.6% |
| Samoans | 5.1 /100 | #212 | Tragic 2.6% |
| Ecuadorians | 4.7 /100 | #213 | Tragic 2.6% |
| Immigrants | Honduras | 4.7 /100 | #214 | Tragic 2.6% |
| Immigrants | Thailand | 4.5 /100 | #215 | Tragic 2.6% |
| Whites/Caucasians | 4.4 /100 | #216 | Tragic 2.6% |
| Celtics | 4.4 /100 | #217 | Tragic 2.6% |
| Scotch-Irish | 4.1 /100 | #218 | Tragic 2.6% |
| Immigrants | Moldova | 4.0 /100 | #219 | Tragic 2.6% |
| Sub-Saharan Africans | 4.0 /100 | #220 | Tragic 2.6% |
| Hondurans | 3.8 /100 | #221 | Tragic 2.6% |
| Spaniards | 3.8 /100 | #222 | Tragic 2.6% |