Immigrants from Liberia vs Immigrants from Barbados Self-Care Disability
COMPARE
Immigrants from Liberia
Immigrants from Barbados
Self-Care Disability
Self-Care Disability Comparison
Immigrants from Liberia
Immigrants from Barbados
2.6%
SELF-CARE DISABILITY
0.4/ 100
METRIC RATING
251st/ 347
METRIC RANK
2.7%
SELF-CARE DISABILITY
0.0/ 100
METRIC RATING
288th/ 347
METRIC RANK
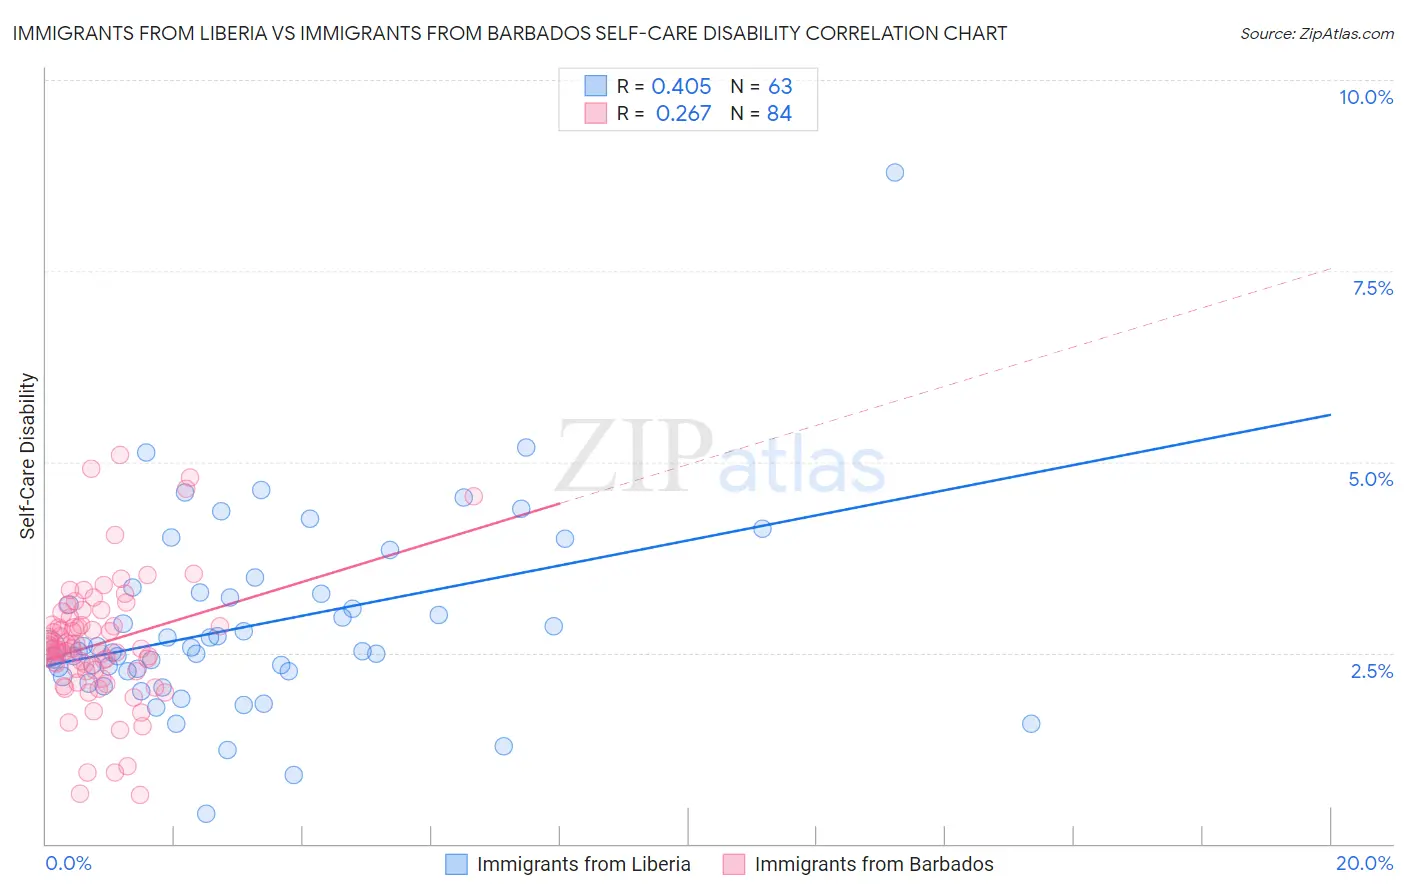
Immigrants from Liberia vs Immigrants from Barbados Self-Care Disability Correlation Chart
The statistical analysis conducted on geographies consisting of 135,176,274 people shows a moderate positive correlation between the proportion of Immigrants from Liberia and percentage of population with self-care disability in the United States with a correlation coefficient (R) of 0.405 and weighted average of 2.6%. Similarly, the statistical analysis conducted on geographies consisting of 112,740,636 people shows a weak positive correlation between the proportion of Immigrants from Barbados and percentage of population with self-care disability in the United States with a correlation coefficient (R) of 0.267 and weighted average of 2.7%, a difference of 3.6%.
Self-Care Disability Correlation Summary
| Measurement | Immigrants from Liberia | Immigrants from Barbados |
| Minimum | 0.40% | 0.63% |
| Maximum | 8.8% | 5.1% |
| Range | 8.4% | 4.5% |
| Mean | 2.9% | 2.6% |
| Median | 2.6% | 2.6% |
| Interquartile 25% (IQ1) | 2.3% | 2.3% |
| Interquartile 75% (IQ3) | 3.3% | 2.9% |
| Interquartile Range (IQR) | 1.0% | 0.65% |
| Standard Deviation (Sample) | 1.3% | 0.84% |
| Standard Deviation (Population) | 1.2% | 0.83% |
Similar Demographics by Self-Care Disability
Demographics Similar to Immigrants from Liberia by Self-Care Disability
In terms of self-care disability, the demographic groups most similar to Immigrants from Liberia are Immigrants from Bangladesh (2.6%, a difference of 0.070%), Portuguese (2.6%, a difference of 0.080%), Immigrants from Haiti (2.6%, a difference of 0.15%), Mexican American Indian (2.6%, a difference of 0.16%), and Haitian (2.6%, a difference of 0.17%).
| Demographics | Rating | Rank | Self-Care Disability |
| Yuman | 0.8 /100 | #244 | Tragic 2.6% |
| Immigrants | Western Asia | 0.6 /100 | #245 | Tragic 2.6% |
| Cheyenne | 0.6 /100 | #246 | Tragic 2.6% |
| Immigrants | Albania | 0.6 /100 | #247 | Tragic 2.6% |
| Nicaraguans | 0.6 /100 | #248 | Tragic 2.6% |
| Mexican American Indians | 0.5 /100 | #249 | Tragic 2.6% |
| Portuguese | 0.4 /100 | #250 | Tragic 2.6% |
| Immigrants | Liberia | 0.4 /100 | #251 | Tragic 2.6% |
| Immigrants | Bangladesh | 0.4 /100 | #252 | Tragic 2.6% |
| Immigrants | Haiti | 0.3 /100 | #253 | Tragic 2.6% |
| Haitians | 0.3 /100 | #254 | Tragic 2.6% |
| Tsimshian | 0.3 /100 | #255 | Tragic 2.6% |
| Immigrants | Central America | 0.3 /100 | #256 | Tragic 2.6% |
| Potawatomi | 0.3 /100 | #257 | Tragic 2.6% |
| Immigrants | Nonimmigrants | 0.3 /100 | #258 | Tragic 2.6% |
Demographics Similar to Immigrants from Barbados by Self-Care Disability
In terms of self-care disability, the demographic groups most similar to Immigrants from Barbados are Immigrants from Jamaica (2.7%, a difference of 0.030%), African (2.7%, a difference of 0.10%), Cuban (2.7%, a difference of 0.25%), French American Indian (2.7%, a difference of 0.37%), and Guyanese (2.7%, a difference of 0.52%).
| Demographics | Rating | Rank | Self-Care Disability |
| Immigrants | Iraq | 0.0 /100 | #281 | Tragic 2.7% |
| Apache | 0.0 /100 | #282 | Tragic 2.7% |
| Delaware | 0.0 /100 | #283 | Tragic 2.7% |
| Fijians | 0.0 /100 | #284 | Tragic 2.7% |
| Jamaicans | 0.0 /100 | #285 | Tragic 2.7% |
| French American Indians | 0.0 /100 | #286 | Tragic 2.7% |
| Immigrants | Jamaica | 0.0 /100 | #287 | Tragic 2.7% |
| Immigrants | Barbados | 0.0 /100 | #288 | Tragic 2.7% |
| Africans | 0.0 /100 | #289 | Tragic 2.7% |
| Cubans | 0.0 /100 | #290 | Tragic 2.7% |
| Guyanese | 0.0 /100 | #291 | Tragic 2.7% |
| Central American Indians | 0.0 /100 | #292 | Tragic 2.7% |
| Belizeans | 0.0 /100 | #293 | Tragic 2.7% |
| Blackfeet | 0.0 /100 | #294 | Tragic 2.7% |
| Barbadians | 0.0 /100 | #295 | Tragic 2.7% |