Immigrants from Switzerland vs Immigrants from Barbados Self-Care Disability
COMPARE
Immigrants from Switzerland
Immigrants from Barbados
Self-Care Disability
Self-Care Disability Comparison
Immigrants from Switzerland
Immigrants from Barbados
2.3%
SELF-CARE DISABILITY
99.1/ 100
METRIC RATING
74th/ 347
METRIC RANK
2.7%
SELF-CARE DISABILITY
0.0/ 100
METRIC RATING
288th/ 347
METRIC RANK
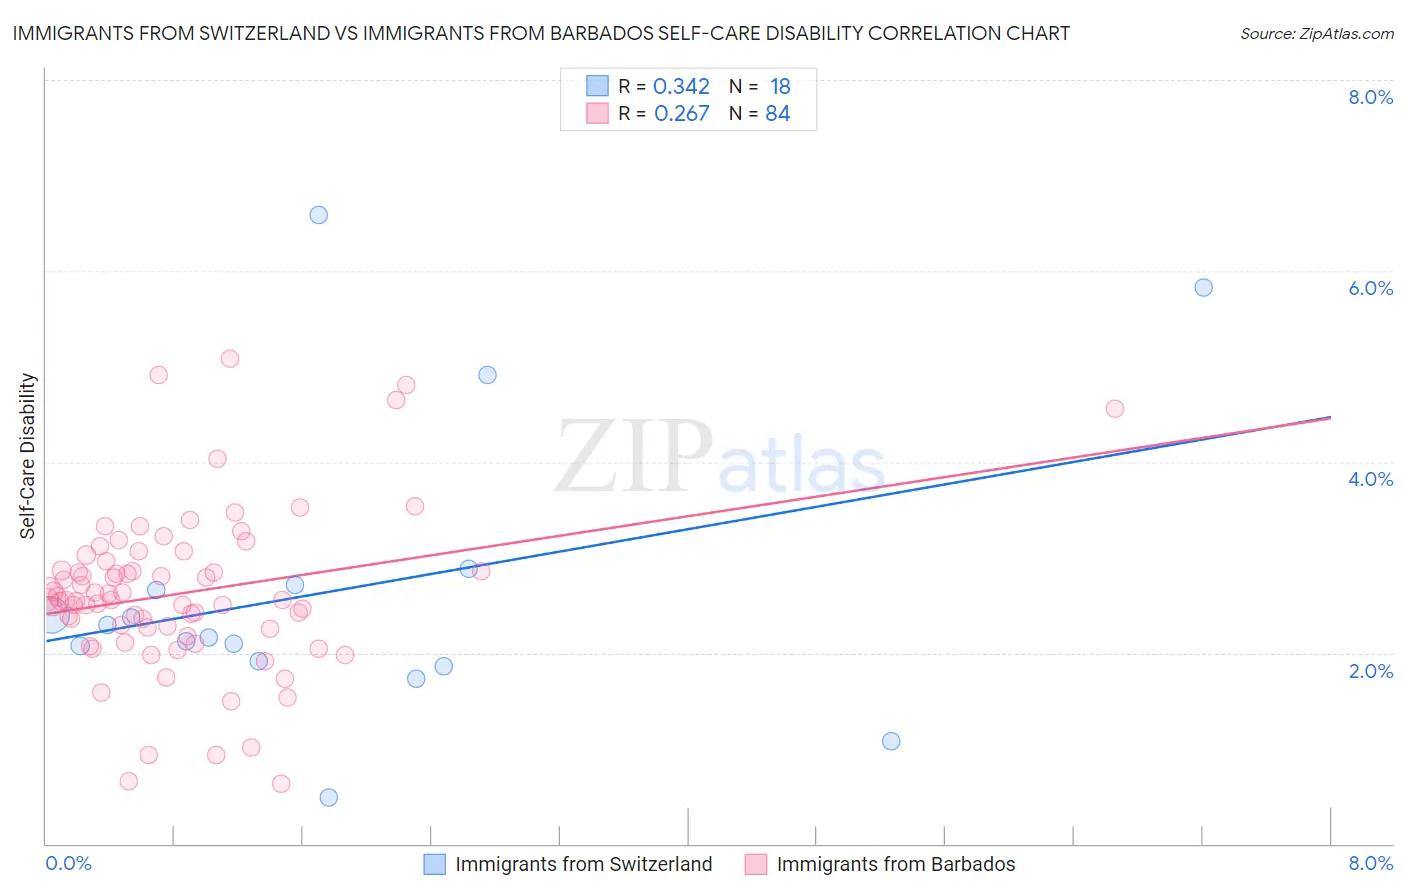
Immigrants from Switzerland vs Immigrants from Barbados Self-Care Disability Correlation Chart
The statistical analysis conducted on geographies consisting of 148,009,249 people shows a mild positive correlation between the proportion of Immigrants from Switzerland and percentage of population with self-care disability in the United States with a correlation coefficient (R) of 0.342 and weighted average of 2.3%. Similarly, the statistical analysis conducted on geographies consisting of 112,740,636 people shows a weak positive correlation between the proportion of Immigrants from Barbados and percentage of population with self-care disability in the United States with a correlation coefficient (R) of 0.267 and weighted average of 2.7%, a difference of 17.0%.
Self-Care Disability Correlation Summary
| Measurement | Immigrants from Switzerland | Immigrants from Barbados |
| Minimum | 0.48% | 0.63% |
| Maximum | 6.6% | 5.1% |
| Range | 6.1% | 4.5% |
| Mean | 2.7% | 2.6% |
| Median | 2.2% | 2.6% |
| Interquartile 25% (IQ1) | 1.9% | 2.3% |
| Interquartile 75% (IQ3) | 2.7% | 2.9% |
| Interquartile Range (IQR) | 0.81% | 0.65% |
| Standard Deviation (Sample) | 1.6% | 0.84% |
| Standard Deviation (Population) | 1.5% | 0.83% |
Similar Demographics by Self-Care Disability
Demographics Similar to Immigrants from Switzerland by Self-Care Disability
In terms of self-care disability, the demographic groups most similar to Immigrants from Switzerland are Immigrants from Netherlands (2.3%, a difference of 0.040%), Immigrants from China (2.3%, a difference of 0.050%), Immigrants from Egypt (2.3%, a difference of 0.060%), Eastern European (2.3%, a difference of 0.090%), and Asian (2.3%, a difference of 0.12%).
| Demographics | Rating | Rank | Self-Care Disability |
| South Africans | 99.3 /100 | #67 | Exceptional 2.3% |
| Immigrants | Zaire | 99.2 /100 | #68 | Exceptional 2.3% |
| Immigrants | Norway | 99.2 /100 | #69 | Exceptional 2.3% |
| Immigrants | Northern Europe | 99.2 /100 | #70 | Exceptional 2.3% |
| Asians | 99.2 /100 | #71 | Exceptional 2.3% |
| Eastern Europeans | 99.2 /100 | #72 | Exceptional 2.3% |
| Immigrants | Egypt | 99.1 /100 | #73 | Exceptional 2.3% |
| Immigrants | Switzerland | 99.1 /100 | #74 | Exceptional 2.3% |
| Immigrants | Netherlands | 99.1 /100 | #75 | Exceptional 2.3% |
| Immigrants | China | 99.1 /100 | #76 | Exceptional 2.3% |
| Immigrants | Middle Africa | 99.0 /100 | #77 | Exceptional 2.3% |
| Immigrants | Ireland | 99.0 /100 | #78 | Exceptional 2.3% |
| Immigrants | Kenya | 99.0 /100 | #79 | Exceptional 2.3% |
| Chileans | 98.8 /100 | #80 | Exceptional 2.3% |
| Ugandans | 98.8 /100 | #81 | Exceptional 2.3% |
Demographics Similar to Immigrants from Barbados by Self-Care Disability
In terms of self-care disability, the demographic groups most similar to Immigrants from Barbados are Immigrants from Jamaica (2.7%, a difference of 0.030%), African (2.7%, a difference of 0.10%), Cuban (2.7%, a difference of 0.25%), French American Indian (2.7%, a difference of 0.37%), and Guyanese (2.7%, a difference of 0.52%).
| Demographics | Rating | Rank | Self-Care Disability |
| Immigrants | Iraq | 0.0 /100 | #281 | Tragic 2.7% |
| Apache | 0.0 /100 | #282 | Tragic 2.7% |
| Delaware | 0.0 /100 | #283 | Tragic 2.7% |
| Fijians | 0.0 /100 | #284 | Tragic 2.7% |
| Jamaicans | 0.0 /100 | #285 | Tragic 2.7% |
| French American Indians | 0.0 /100 | #286 | Tragic 2.7% |
| Immigrants | Jamaica | 0.0 /100 | #287 | Tragic 2.7% |
| Immigrants | Barbados | 0.0 /100 | #288 | Tragic 2.7% |
| Africans | 0.0 /100 | #289 | Tragic 2.7% |
| Cubans | 0.0 /100 | #290 | Tragic 2.7% |
| Guyanese | 0.0 /100 | #291 | Tragic 2.7% |
| Central American Indians | 0.0 /100 | #292 | Tragic 2.7% |
| Belizeans | 0.0 /100 | #293 | Tragic 2.7% |
| Blackfeet | 0.0 /100 | #294 | Tragic 2.7% |
| Barbadians | 0.0 /100 | #295 | Tragic 2.7% |