Immigrants from Korea vs Houma Female Disability
COMPARE
Immigrants from Korea
Houma
Female Disability
Female Disability Comparison
Immigrants from Korea
Houma
10.6%
FEMALE DISABILITY
100.0/ 100
METRIC RATING
11th/ 347
METRIC RANK
16.9%
FEMALE DISABILITY
0.0/ 100
METRIC RATING
347th/ 347
METRIC RANK
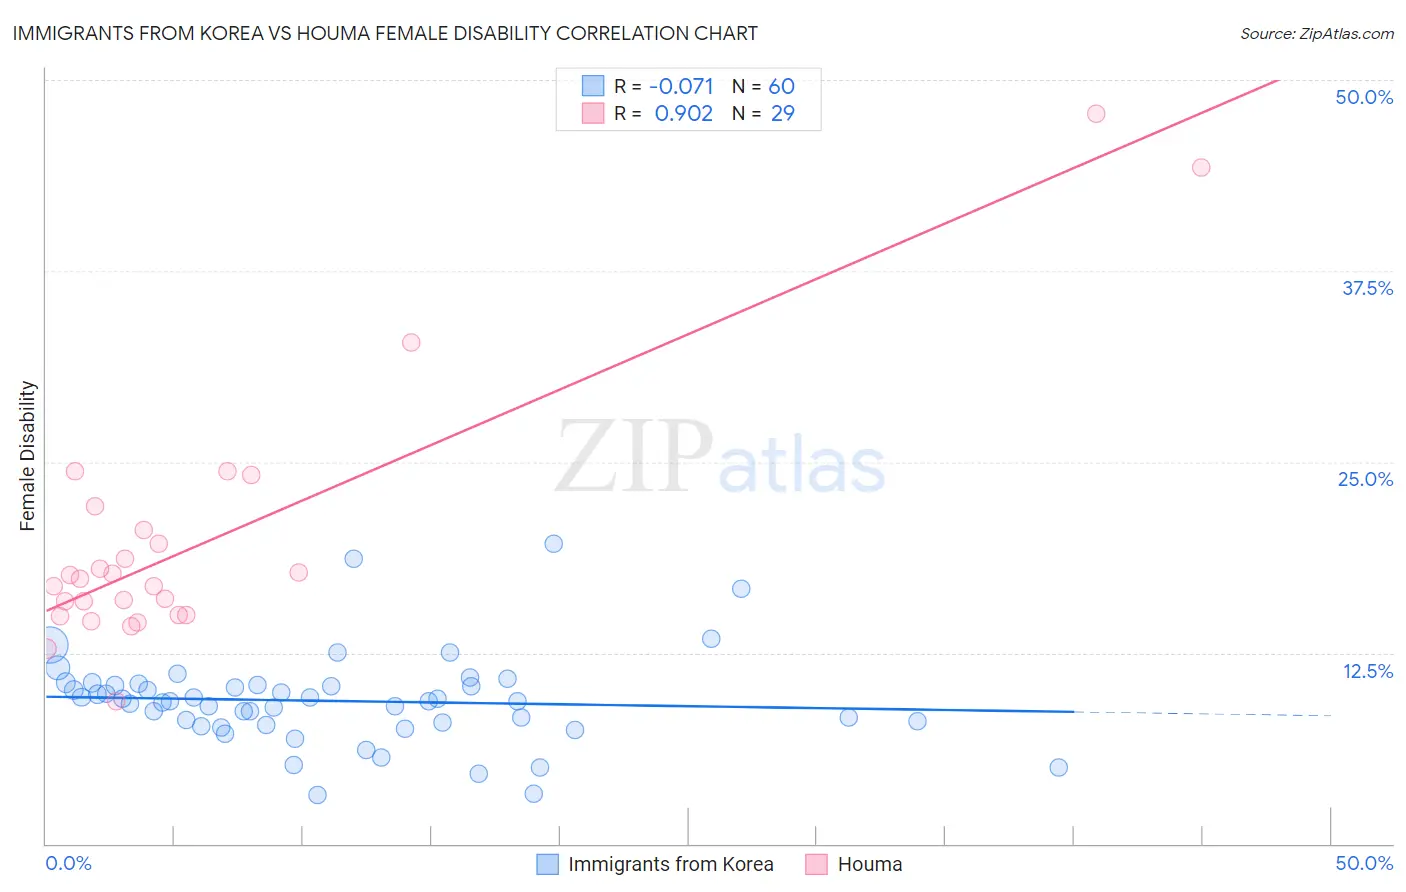
Immigrants from Korea vs Houma Female Disability Correlation Chart
The statistical analysis conducted on geographies consisting of 416,288,361 people shows a slight negative correlation between the proportion of Immigrants from Korea and percentage of females with a disability in the United States with a correlation coefficient (R) of -0.071 and weighted average of 10.6%. Similarly, the statistical analysis conducted on geographies consisting of 36,798,615 people shows a near-perfect positive correlation between the proportion of Houma and percentage of females with a disability in the United States with a correlation coefficient (R) of 0.902 and weighted average of 16.9%, a difference of 58.9%.
Female Disability Correlation Summary
| Measurement | Immigrants from Korea | Houma |
| Minimum | 3.2% | 9.3% |
| Maximum | 19.6% | 47.8% |
| Range | 16.4% | 38.4% |
| Mean | 9.4% | 19.8% |
| Median | 9.3% | 17.3% |
| Interquartile 25% (IQ1) | 7.8% | 14.9% |
| Interquartile 75% (IQ3) | 10.4% | 21.3% |
| Interquartile Range (IQR) | 2.6% | 6.4% |
| Standard Deviation (Sample) | 3.0% | 8.5% |
| Standard Deviation (Population) | 3.0% | 8.4% |
Similar Demographics by Female Disability
Demographics Similar to Immigrants from Korea by Female Disability
In terms of female disability, the demographic groups most similar to Immigrants from Korea are Immigrants from Hong Kong (10.6%, a difference of 0.17%), Immigrants from Israel (10.7%, a difference of 0.42%), Immigrants from Eastern Asia (10.7%, a difference of 0.49%), Immigrants from China (10.7%, a difference of 0.52%), and Iranian (10.6%, a difference of 0.82%).
| Demographics | Rating | Rank | Female Disability |
| Thais | 100.0 /100 | #4 | Exceptional 10.2% |
| Immigrants | Bolivia | 100.0 /100 | #5 | Exceptional 10.3% |
| Bolivians | 100.0 /100 | #6 | Exceptional 10.4% |
| Immigrants | Singapore | 100.0 /100 | #7 | Exceptional 10.4% |
| Immigrants | South Central Asia | 100.0 /100 | #8 | Exceptional 10.5% |
| Iranians | 100.0 /100 | #9 | Exceptional 10.6% |
| Immigrants | Hong Kong | 100.0 /100 | #10 | Exceptional 10.6% |
| Immigrants | Korea | 100.0 /100 | #11 | Exceptional 10.6% |
| Immigrants | Israel | 100.0 /100 | #12 | Exceptional 10.7% |
| Immigrants | Eastern Asia | 100.0 /100 | #13 | Exceptional 10.7% |
| Immigrants | China | 100.0 /100 | #14 | Exceptional 10.7% |
| Burmese | 100.0 /100 | #15 | Exceptional 10.7% |
| Okinawans | 100.0 /100 | #16 | Exceptional 10.8% |
| Indians (Asian) | 100.0 /100 | #17 | Exceptional 10.8% |
| Immigrants | Iran | 100.0 /100 | #18 | Exceptional 10.8% |
Demographics Similar to Houma by Female Disability
In terms of female disability, the demographic groups most similar to Houma are Tsimshian (16.8%, a difference of 0.77%), Puerto Rican (16.6%, a difference of 1.7%), Kiowa (15.8%, a difference of 7.0%), Lumbee (15.8%, a difference of 7.1%), and Creek (15.7%, a difference of 7.9%).
| Demographics | Rating | Rank | Female Disability |
| Immigrants | Azores | 0.0 /100 | #333 | Tragic 14.9% |
| Cherokee | 0.0 /100 | #334 | Tragic 14.9% |
| Cajuns | 0.0 /100 | #335 | Tragic 14.9% |
| Seminole | 0.0 /100 | #336 | Tragic 15.0% |
| Tohono O'odham | 0.0 /100 | #337 | Tragic 15.0% |
| Dutch West Indians | 0.0 /100 | #338 | Tragic 15.0% |
| Colville | 0.0 /100 | #339 | Tragic 15.1% |
| Chickasaw | 0.0 /100 | #340 | Tragic 15.2% |
| Choctaw | 0.0 /100 | #341 | Tragic 15.4% |
| Creek | 0.0 /100 | #342 | Tragic 15.7% |
| Lumbee | 0.0 /100 | #343 | Tragic 15.8% |
| Kiowa | 0.0 /100 | #344 | Tragic 15.8% |
| Puerto Ricans | 0.0 /100 | #345 | Tragic 16.6% |
| Tsimshian | 0.0 /100 | #346 | Tragic 16.8% |
| Houma | 0.0 /100 | #347 | Tragic 16.9% |