Hungarian vs Houma Female Disability
COMPARE
Hungarian
Houma
Female Disability
Female Disability Comparison
Hungarians
Houma
12.5%
FEMALE DISABILITY
7.2/ 100
METRIC RATING
229th/ 347
METRIC RANK
16.9%
FEMALE DISABILITY
0.0/ 100
METRIC RATING
347th/ 347
METRIC RANK
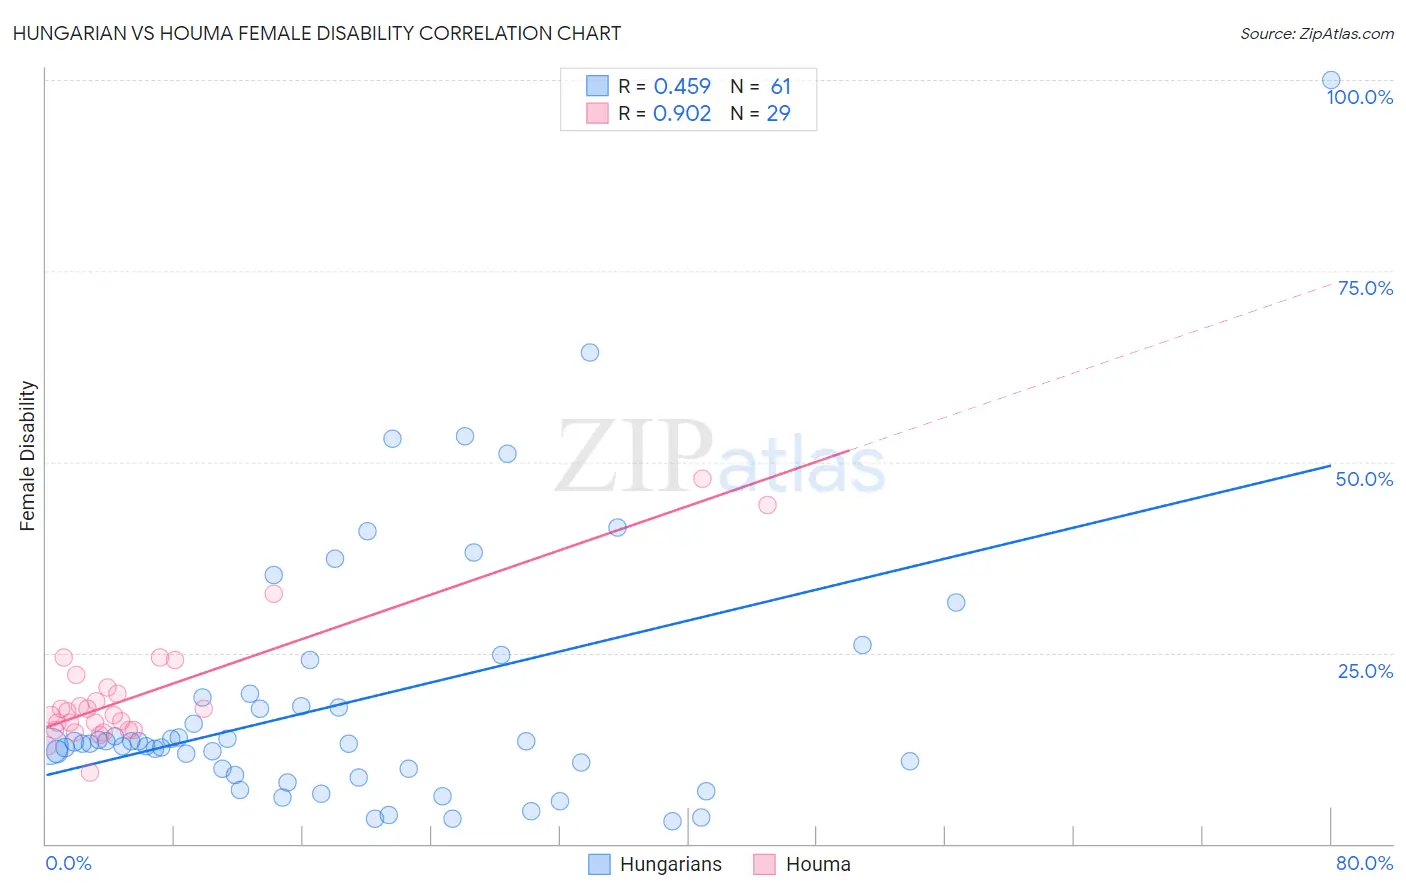
Hungarian vs Houma Female Disability Correlation Chart
The statistical analysis conducted on geographies consisting of 486,134,772 people shows a moderate positive correlation between the proportion of Hungarians and percentage of females with a disability in the United States with a correlation coefficient (R) of 0.459 and weighted average of 12.5%. Similarly, the statistical analysis conducted on geographies consisting of 36,798,615 people shows a near-perfect positive correlation between the proportion of Houma and percentage of females with a disability in the United States with a correlation coefficient (R) of 0.902 and weighted average of 16.9%, a difference of 35.3%.
Female Disability Correlation Summary
| Measurement | Hungarian | Houma |
| Minimum | 2.9% | 9.3% |
| Maximum | 100.0% | 47.8% |
| Range | 97.1% | 38.4% |
| Mean | 18.7% | 19.8% |
| Median | 13.1% | 17.3% |
| Interquartile 25% (IQ1) | 9.4% | 14.9% |
| Interquartile 75% (IQ3) | 19.4% | 21.3% |
| Interquartile Range (IQR) | 10.0% | 6.4% |
| Standard Deviation (Sample) | 17.3% | 8.5% |
| Standard Deviation (Population) | 17.2% | 8.4% |
Similar Demographics by Female Disability
Demographics Similar to Hungarians by Female Disability
In terms of female disability, the demographic groups most similar to Hungarians are Immigrants from Belize (12.5%, a difference of 0.030%), Immigrants from Cambodia (12.5%, a difference of 0.070%), Assyrian/Chaldean/Syriac (12.5%, a difference of 0.10%), Hispanic or Latino (12.5%, a difference of 0.11%), and Belgian (12.5%, a difference of 0.11%).
| Demographics | Rating | Rank | Female Disability |
| Italians | 10.7 /100 | #222 | Poor 12.4% |
| Guamanians/Chamorros | 9.5 /100 | #223 | Tragic 12.5% |
| Belizeans | 9.3 /100 | #224 | Tragic 12.5% |
| Poles | 8.4 /100 | #225 | Tragic 12.5% |
| Hispanics or Latinos | 8.0 /100 | #226 | Tragic 12.5% |
| Assyrians/Chaldeans/Syriacs | 8.0 /100 | #227 | Tragic 12.5% |
| Immigrants | Cambodia | 7.8 /100 | #228 | Tragic 12.5% |
| Hungarians | 7.2 /100 | #229 | Tragic 12.5% |
| Immigrants | Belize | 7.0 /100 | #230 | Tragic 12.5% |
| Belgians | 6.5 /100 | #231 | Tragic 12.5% |
| Immigrants | Somalia | 5.9 /100 | #232 | Tragic 12.5% |
| Immigrants | Iraq | 5.3 /100 | #233 | Tragic 12.5% |
| Scandinavians | 5.3 /100 | #234 | Tragic 12.5% |
| Malaysians | 5.0 /100 | #235 | Tragic 12.5% |
| Immigrants | West Indies | 4.4 /100 | #236 | Tragic 12.6% |
Demographics Similar to Houma by Female Disability
In terms of female disability, the demographic groups most similar to Houma are Tsimshian (16.8%, a difference of 0.77%), Puerto Rican (16.6%, a difference of 1.7%), Kiowa (15.8%, a difference of 7.0%), Lumbee (15.8%, a difference of 7.1%), and Creek (15.7%, a difference of 7.9%).
| Demographics | Rating | Rank | Female Disability |
| Immigrants | Azores | 0.0 /100 | #333 | Tragic 14.9% |
| Cherokee | 0.0 /100 | #334 | Tragic 14.9% |
| Cajuns | 0.0 /100 | #335 | Tragic 14.9% |
| Seminole | 0.0 /100 | #336 | Tragic 15.0% |
| Tohono O'odham | 0.0 /100 | #337 | Tragic 15.0% |
| Dutch West Indians | 0.0 /100 | #338 | Tragic 15.0% |
| Colville | 0.0 /100 | #339 | Tragic 15.1% |
| Chickasaw | 0.0 /100 | #340 | Tragic 15.2% |
| Choctaw | 0.0 /100 | #341 | Tragic 15.4% |
| Creek | 0.0 /100 | #342 | Tragic 15.7% |
| Lumbee | 0.0 /100 | #343 | Tragic 15.8% |
| Kiowa | 0.0 /100 | #344 | Tragic 15.8% |
| Puerto Ricans | 0.0 /100 | #345 | Tragic 16.6% |
| Tsimshian | 0.0 /100 | #346 | Tragic 16.8% |
| Houma | 0.0 /100 | #347 | Tragic 16.9% |