Immigrants from Hungary vs Chippewa Self-Care Disability
COMPARE
Immigrants from Hungary
Chippewa
Self-Care Disability
Self-Care Disability Comparison
Immigrants from Hungary
Chippewa
2.4%
SELF-CARE DISABILITY
89.6/ 100
METRIC RATING
128th/ 347
METRIC RANK
2.6%
SELF-CARE DISABILITY
0.2/ 100
METRIC RATING
260th/ 347
METRIC RANK
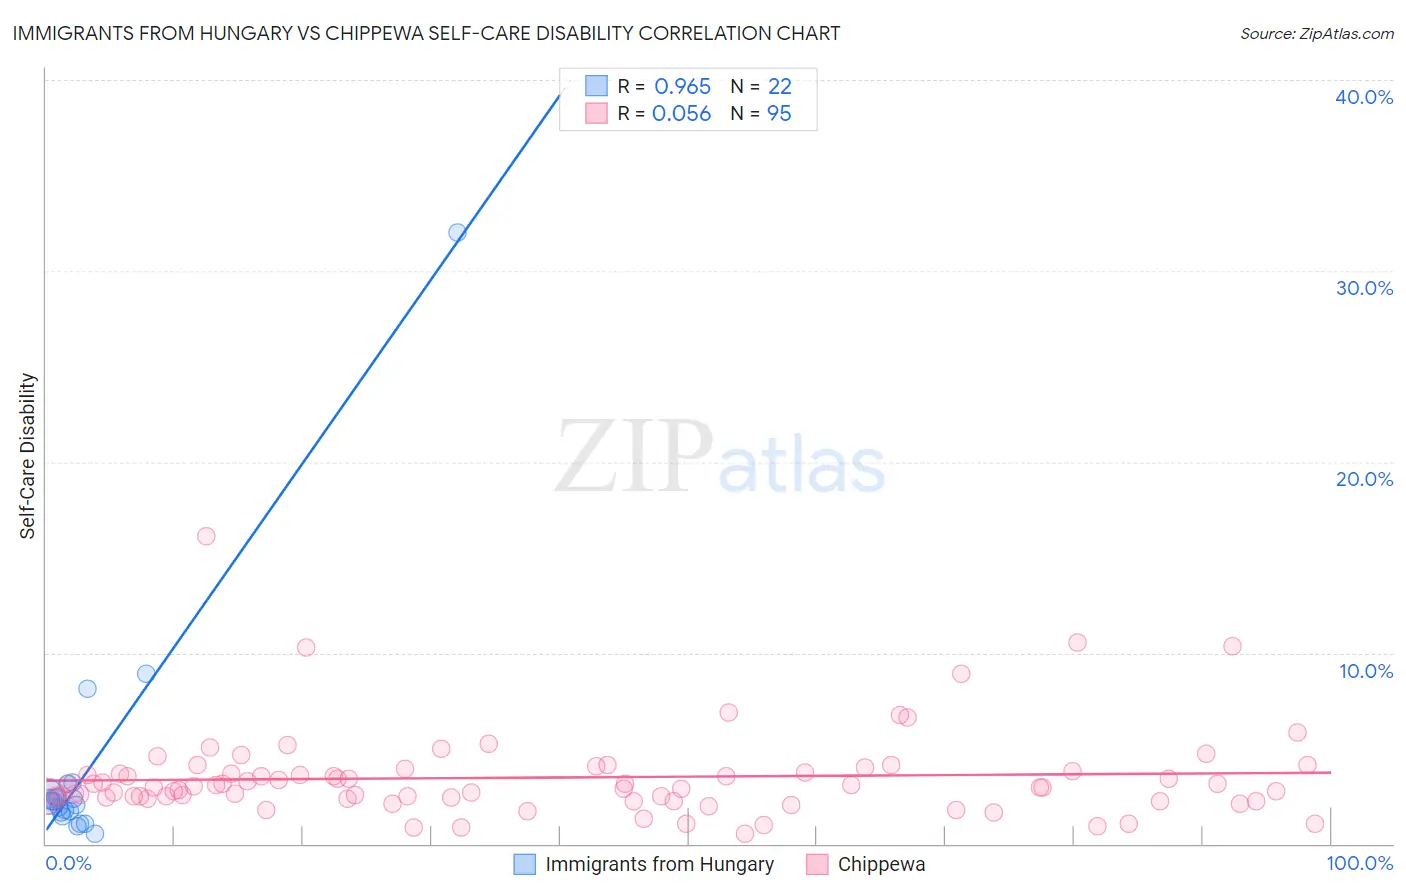
Immigrants from Hungary vs Chippewa Self-Care Disability Correlation Chart
The statistical analysis conducted on geographies consisting of 195,644,142 people shows a perfect positive correlation between the proportion of Immigrants from Hungary and percentage of population with self-care disability in the United States with a correlation coefficient (R) of 0.965 and weighted average of 2.4%. Similarly, the statistical analysis conducted on geographies consisting of 214,880,520 people shows a slight positive correlation between the proportion of Chippewa and percentage of population with self-care disability in the United States with a correlation coefficient (R) of 0.056 and weighted average of 2.6%, a difference of 10.1%.
Self-Care Disability Correlation Summary
| Measurement | Immigrants from Hungary | Chippewa |
| Minimum | 0.51% | 0.52% |
| Maximum | 32.0% | 16.1% |
| Range | 31.5% | 15.6% |
| Mean | 3.9% | 3.5% |
| Median | 2.2% | 2.9% |
| Interquartile 25% (IQ1) | 1.7% | 2.4% |
| Interquartile 75% (IQ3) | 2.5% | 3.8% |
| Interquartile Range (IQR) | 0.80% | 1.4% |
| Standard Deviation (Sample) | 6.6% | 2.3% |
| Standard Deviation (Population) | 6.4% | 2.3% |
Similar Demographics by Self-Care Disability
Demographics Similar to Immigrants from Hungary by Self-Care Disability
In terms of self-care disability, the demographic groups most similar to Immigrants from Hungary are Colombian (2.4%, a difference of 0.010%), Hmong (2.4%, a difference of 0.040%), Immigrants from Romania (2.4%, a difference of 0.050%), Immigrants from Morocco (2.4%, a difference of 0.080%), and Immigrants from North America (2.4%, a difference of 0.080%).
| Demographics | Rating | Rank | Self-Care Disability |
| Peruvians | 91.3 /100 | #121 | Exceptional 2.4% |
| Belgians | 90.9 /100 | #122 | Exceptional 2.4% |
| Immigrants | Nigeria | 90.3 /100 | #123 | Exceptional 2.4% |
| Immigrants | Morocco | 90.2 /100 | #124 | Exceptional 2.4% |
| Immigrants | North America | 90.2 /100 | #124 | Exceptional 2.4% |
| Hmong | 89.9 /100 | #126 | Excellent 2.4% |
| Colombians | 89.7 /100 | #127 | Excellent 2.4% |
| Immigrants | Hungary | 89.6 /100 | #128 | Excellent 2.4% |
| Immigrants | Romania | 89.3 /100 | #129 | Excellent 2.4% |
| Immigrants | Austria | 89.0 /100 | #130 | Excellent 2.4% |
| Poles | 88.9 /100 | #131 | Excellent 2.4% |
| Immigrants | South America | 88.8 /100 | #132 | Excellent 2.4% |
| Immigrants | Colombia | 88.5 /100 | #133 | Excellent 2.4% |
| Russians | 88.2 /100 | #134 | Excellent 2.4% |
| Laotians | 87.8 /100 | #135 | Excellent 2.4% |
Demographics Similar to Chippewa by Self-Care Disability
In terms of self-care disability, the demographic groups most similar to Chippewa are Arapaho (2.6%, a difference of 0.020%), Immigrants from Belarus (2.6%, a difference of 0.040%), Nonimmigrants (2.6%, a difference of 0.11%), Shoshone (2.7%, a difference of 0.16%), and Potawatomi (2.6%, a difference of 0.18%).
| Demographics | Rating | Rank | Self-Care Disability |
| Immigrants | Haiti | 0.3 /100 | #253 | Tragic 2.6% |
| Haitians | 0.3 /100 | #254 | Tragic 2.6% |
| Tsimshian | 0.3 /100 | #255 | Tragic 2.6% |
| Immigrants | Central America | 0.3 /100 | #256 | Tragic 2.6% |
| Potawatomi | 0.3 /100 | #257 | Tragic 2.6% |
| Immigrants | Nonimmigrants | 0.3 /100 | #258 | Tragic 2.6% |
| Immigrants | Belarus | 0.2 /100 | #259 | Tragic 2.6% |
| Chippewa | 0.2 /100 | #260 | Tragic 2.6% |
| Arapaho | 0.2 /100 | #261 | Tragic 2.6% |
| Shoshone | 0.2 /100 | #262 | Tragic 2.7% |
| Immigrants | Latin America | 0.2 /100 | #263 | Tragic 2.7% |
| Immigrants | Iran | 0.2 /100 | #264 | Tragic 2.7% |
| Immigrants | Nicaragua | 0.2 /100 | #265 | Tragic 2.7% |
| Immigrants | Cambodia | 0.1 /100 | #266 | Tragic 2.7% |
| Yaqui | 0.1 /100 | #267 | Tragic 2.7% |