Hopi vs Immigrants from Liberia Female Disability
COMPARE
Hopi
Immigrants from Liberia
Female Disability
Female Disability Comparison
Hopi
Immigrants from Liberia
13.7%
FEMALE DISABILITY
0.0/ 100
METRIC RATING
311th/ 347
METRIC RANK
12.9%
FEMALE DISABILITY
0.3/ 100
METRIC RATING
270th/ 347
METRIC RANK
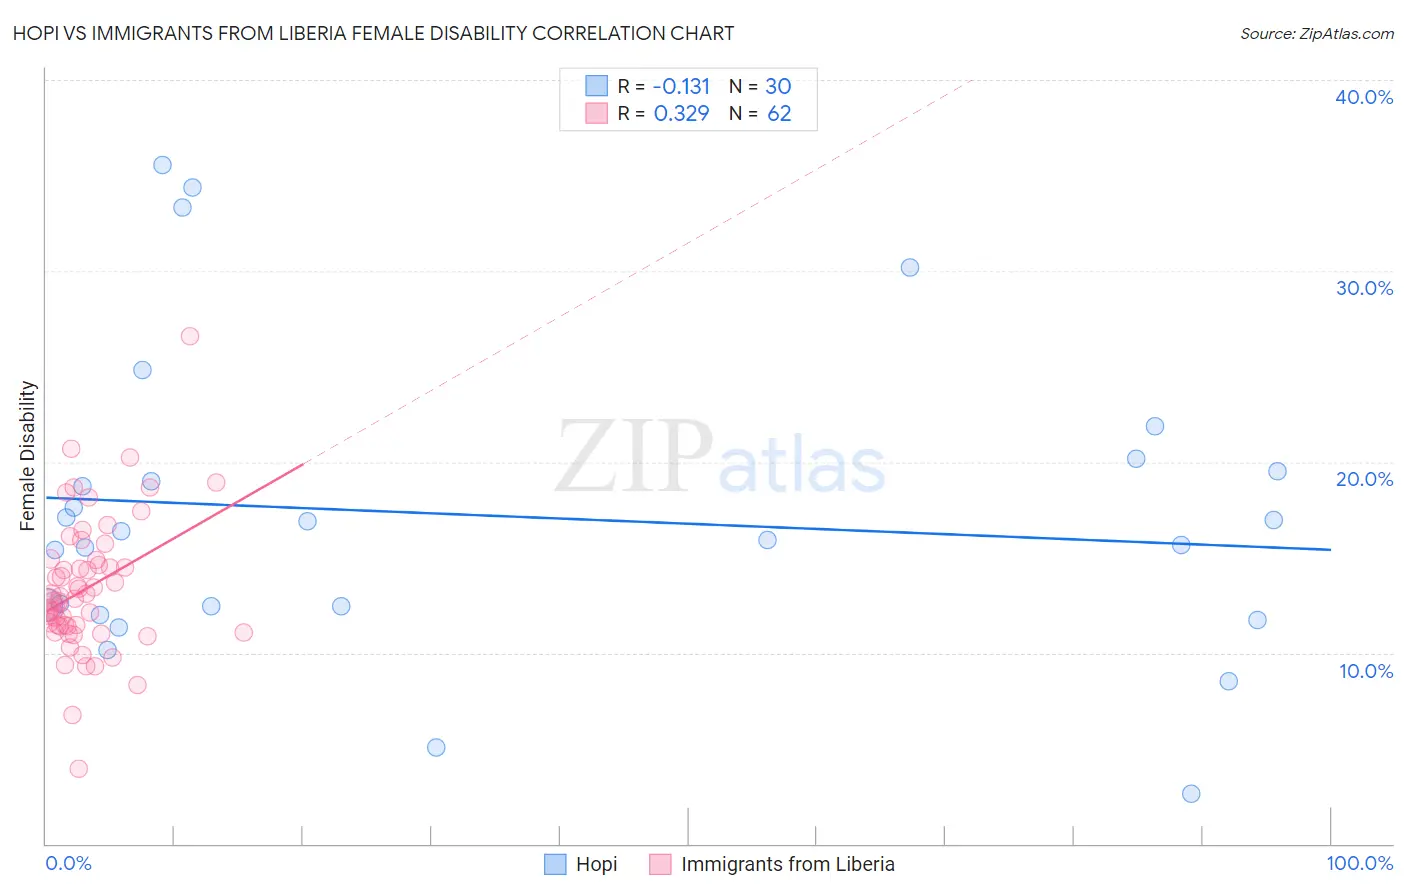
Hopi vs Immigrants from Liberia Female Disability Correlation Chart
The statistical analysis conducted on geographies consisting of 74,733,138 people shows a poor negative correlation between the proportion of Hopi and percentage of females with a disability in the United States with a correlation coefficient (R) of -0.131 and weighted average of 13.7%. Similarly, the statistical analysis conducted on geographies consisting of 135,259,122 people shows a mild positive correlation between the proportion of Immigrants from Liberia and percentage of females with a disability in the United States with a correlation coefficient (R) of 0.329 and weighted average of 12.9%, a difference of 6.9%.
Female Disability Correlation Summary
| Measurement | Hopi | Immigrants from Liberia |
| Minimum | 2.6% | 3.9% |
| Maximum | 35.6% | 26.5% |
| Range | 33.0% | 22.6% |
| Mean | 17.2% | 13.4% |
| Median | 16.2% | 12.9% |
| Interquartile 25% (IQ1) | 12.4% | 11.4% |
| Interquartile 75% (IQ3) | 19.5% | 14.9% |
| Interquartile Range (IQR) | 7.1% | 3.5% |
| Standard Deviation (Sample) | 8.0% | 3.6% |
| Standard Deviation (Population) | 7.8% | 3.6% |
Similar Demographics by Female Disability
Demographics Similar to Hopi by Female Disability
In terms of female disability, the demographic groups most similar to Hopi are Apache (13.7%, a difference of 0.29%), Delaware (13.8%, a difference of 0.31%), French American Indian (13.7%, a difference of 0.41%), Cree (13.7%, a difference of 0.46%), and Blackfeet (13.8%, a difference of 0.63%).
| Demographics | Rating | Rank | Female Disability |
| Immigrants | Micronesia | 0.0 /100 | #304 | Tragic 13.5% |
| Dominicans | 0.0 /100 | #305 | Tragic 13.5% |
| French Canadians | 0.0 /100 | #306 | Tragic 13.6% |
| Central American Indians | 0.0 /100 | #307 | Tragic 13.6% |
| Cree | 0.0 /100 | #308 | Tragic 13.7% |
| French American Indians | 0.0 /100 | #309 | Tragic 13.7% |
| Apache | 0.0 /100 | #310 | Tragic 13.7% |
| Hopi | 0.0 /100 | #311 | Tragic 13.7% |
| Delaware | 0.0 /100 | #312 | Tragic 13.8% |
| Blackfeet | 0.0 /100 | #313 | Tragic 13.8% |
| Puget Sound Salish | 0.0 /100 | #314 | Tragic 13.8% |
| Alaskan Athabascans | 0.0 /100 | #315 | Tragic 13.9% |
| Spanish Americans | 0.0 /100 | #316 | Tragic 14.0% |
| Chippewa | 0.0 /100 | #317 | Tragic 14.0% |
| Paiute | 0.0 /100 | #318 | Tragic 14.0% |
Demographics Similar to Immigrants from Liberia by Female Disability
In terms of female disability, the demographic groups most similar to Immigrants from Liberia are Indonesian (12.8%, a difference of 0.18%), Immigrants from Laos (12.8%, a difference of 0.24%), Senegalese (12.8%, a difference of 0.27%), Finnish (12.8%, a difference of 0.28%), and West Indian (12.8%, a difference of 0.40%).
| Demographics | Rating | Rank | Female Disability |
| Spaniards | 0.7 /100 | #263 | Tragic 12.8% |
| Alaska Natives | 0.6 /100 | #264 | Tragic 12.8% |
| West Indians | 0.5 /100 | #265 | Tragic 12.8% |
| Finns | 0.4 /100 | #266 | Tragic 12.8% |
| Senegalese | 0.4 /100 | #267 | Tragic 12.8% |
| Immigrants | Laos | 0.4 /100 | #268 | Tragic 12.8% |
| Indonesians | 0.4 /100 | #269 | Tragic 12.8% |
| Immigrants | Liberia | 0.3 /100 | #270 | Tragic 12.9% |
| Dutch | 0.2 /100 | #271 | Tragic 12.9% |
| Germans | 0.1 /100 | #272 | Tragic 12.9% |
| Sioux | 0.1 /100 | #273 | Tragic 12.9% |
| Portuguese | 0.1 /100 | #274 | Tragic 13.0% |
| Cheyenne | 0.1 /100 | #275 | Tragic 13.0% |
| Immigrants | Dominica | 0.1 /100 | #276 | Tragic 13.0% |
| Spanish | 0.1 /100 | #277 | Tragic 13.0% |