Hmong vs Immigrants from Cambodia Female Disability
COMPARE
Hmong
Immigrants from Cambodia
Female Disability
Female Disability Comparison
Hmong
Immigrants from Cambodia
13.1%
FEMALE DISABILITY
0.0/ 100
METRIC RATING
284th/ 347
METRIC RANK
12.5%
FEMALE DISABILITY
7.8/ 100
METRIC RATING
228th/ 347
METRIC RANK
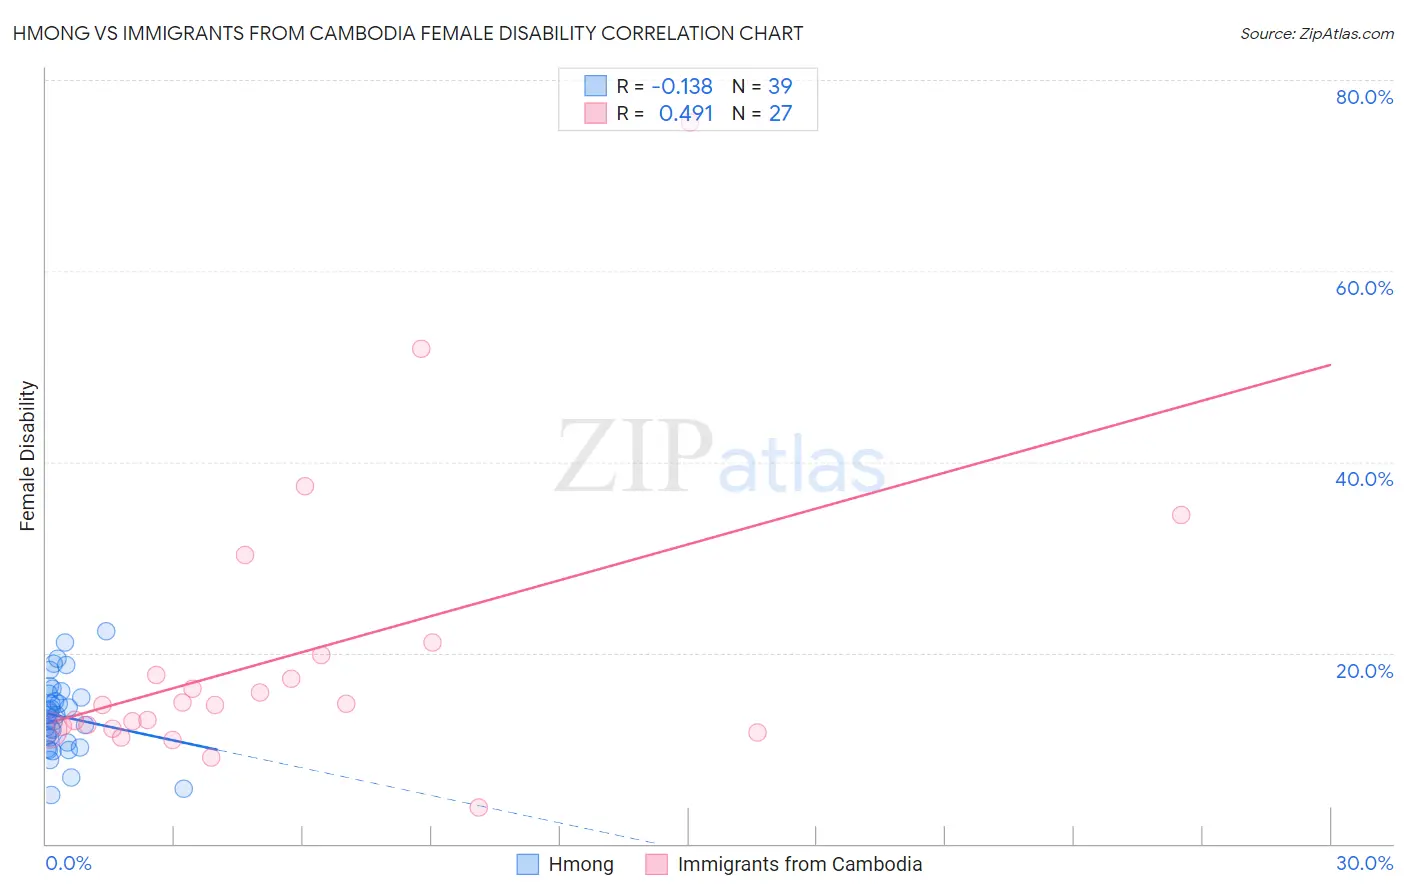
Hmong vs Immigrants from Cambodia Female Disability Correlation Chart
The statistical analysis conducted on geographies consisting of 24,681,034 people shows a poor negative correlation between the proportion of Hmong and percentage of females with a disability in the United States with a correlation coefficient (R) of -0.138 and weighted average of 13.1%. Similarly, the statistical analysis conducted on geographies consisting of 205,152,256 people shows a moderate positive correlation between the proportion of Immigrants from Cambodia and percentage of females with a disability in the United States with a correlation coefficient (R) of 0.491 and weighted average of 12.5%, a difference of 4.9%.
Female Disability Correlation Summary
| Measurement | Hmong | Immigrants from Cambodia |
| Minimum | 5.1% | 3.8% |
| Maximum | 22.2% | 75.5% |
| Range | 17.1% | 71.7% |
| Mean | 13.3% | 19.6% |
| Median | 13.5% | 14.5% |
| Interquartile 25% (IQ1) | 10.5% | 12.0% |
| Interquartile 75% (IQ3) | 15.8% | 19.8% |
| Interquartile Range (IQR) | 5.2% | 7.8% |
| Standard Deviation (Sample) | 3.9% | 15.0% |
| Standard Deviation (Population) | 3.8% | 14.8% |
Similar Demographics by Female Disability
Demographics Similar to Hmong by Female Disability
In terms of female disability, the demographic groups most similar to Hmong are Bangladeshi (13.1%, a difference of 0.050%), Fijian (13.1%, a difference of 0.10%), English (13.1%, a difference of 0.13%), Welsh (13.1%, a difference of 0.14%), and U.S. Virgin Islander (13.1%, a difference of 0.22%).
| Demographics | Rating | Rank | Female Disability |
| Spanish | 0.1 /100 | #277 | Tragic 13.0% |
| Scottish | 0.1 /100 | #278 | Tragic 13.0% |
| Arapaho | 0.1 /100 | #279 | Tragic 13.0% |
| Irish | 0.1 /100 | #280 | Tragic 13.1% |
| U.S. Virgin Islanders | 0.1 /100 | #281 | Tragic 13.1% |
| Welsh | 0.0 /100 | #282 | Tragic 13.1% |
| English | 0.0 /100 | #283 | Tragic 13.1% |
| Hmong | 0.0 /100 | #284 | Tragic 13.1% |
| Bangladeshis | 0.0 /100 | #285 | Tragic 13.1% |
| Fijians | 0.0 /100 | #286 | Tragic 13.1% |
| Yaqui | 0.0 /100 | #287 | Tragic 13.2% |
| Whites/Caucasians | 0.0 /100 | #288 | Tragic 13.2% |
| Tlingit-Haida | 0.0 /100 | #289 | Tragic 13.2% |
| Immigrants | Yemen | 0.0 /100 | #290 | Tragic 13.2% |
| Shoshone | 0.0 /100 | #291 | Tragic 13.2% |
Demographics Similar to Immigrants from Cambodia by Female Disability
In terms of female disability, the demographic groups most similar to Immigrants from Cambodia are Hispanic or Latino (12.5%, a difference of 0.030%), Assyrian/Chaldean/Syriac (12.5%, a difference of 0.030%), Hungarian (12.5%, a difference of 0.070%), Polish (12.5%, a difference of 0.080%), and Immigrants from Belize (12.5%, a difference of 0.11%).
| Demographics | Rating | Rank | Female Disability |
| Native Hawaiians | 10.8 /100 | #221 | Poor 12.4% |
| Italians | 10.7 /100 | #222 | Poor 12.4% |
| Guamanians/Chamorros | 9.5 /100 | #223 | Tragic 12.5% |
| Belizeans | 9.3 /100 | #224 | Tragic 12.5% |
| Poles | 8.4 /100 | #225 | Tragic 12.5% |
| Hispanics or Latinos | 8.0 /100 | #226 | Tragic 12.5% |
| Assyrians/Chaldeans/Syriacs | 8.0 /100 | #227 | Tragic 12.5% |
| Immigrants | Cambodia | 7.8 /100 | #228 | Tragic 12.5% |
| Hungarians | 7.2 /100 | #229 | Tragic 12.5% |
| Immigrants | Belize | 7.0 /100 | #230 | Tragic 12.5% |
| Belgians | 6.5 /100 | #231 | Tragic 12.5% |
| Immigrants | Somalia | 5.9 /100 | #232 | Tragic 12.5% |
| Immigrants | Iraq | 5.3 /100 | #233 | Tragic 12.5% |
| Scandinavians | 5.3 /100 | #234 | Tragic 12.5% |
| Malaysians | 5.0 /100 | #235 | Tragic 12.5% |