Haitian vs Immigrants from Jordan Male Disability
COMPARE
Haitian
Immigrants from Jordan
Male Disability
Male Disability Comparison
Haitians
Immigrants from Jordan
11.2%
MALE DISABILITY
52.5/ 100
METRIC RATING
171st/ 347
METRIC RANK
10.6%
MALE DISABILITY
98.4/ 100
METRIC RATING
80th/ 347
METRIC RANK
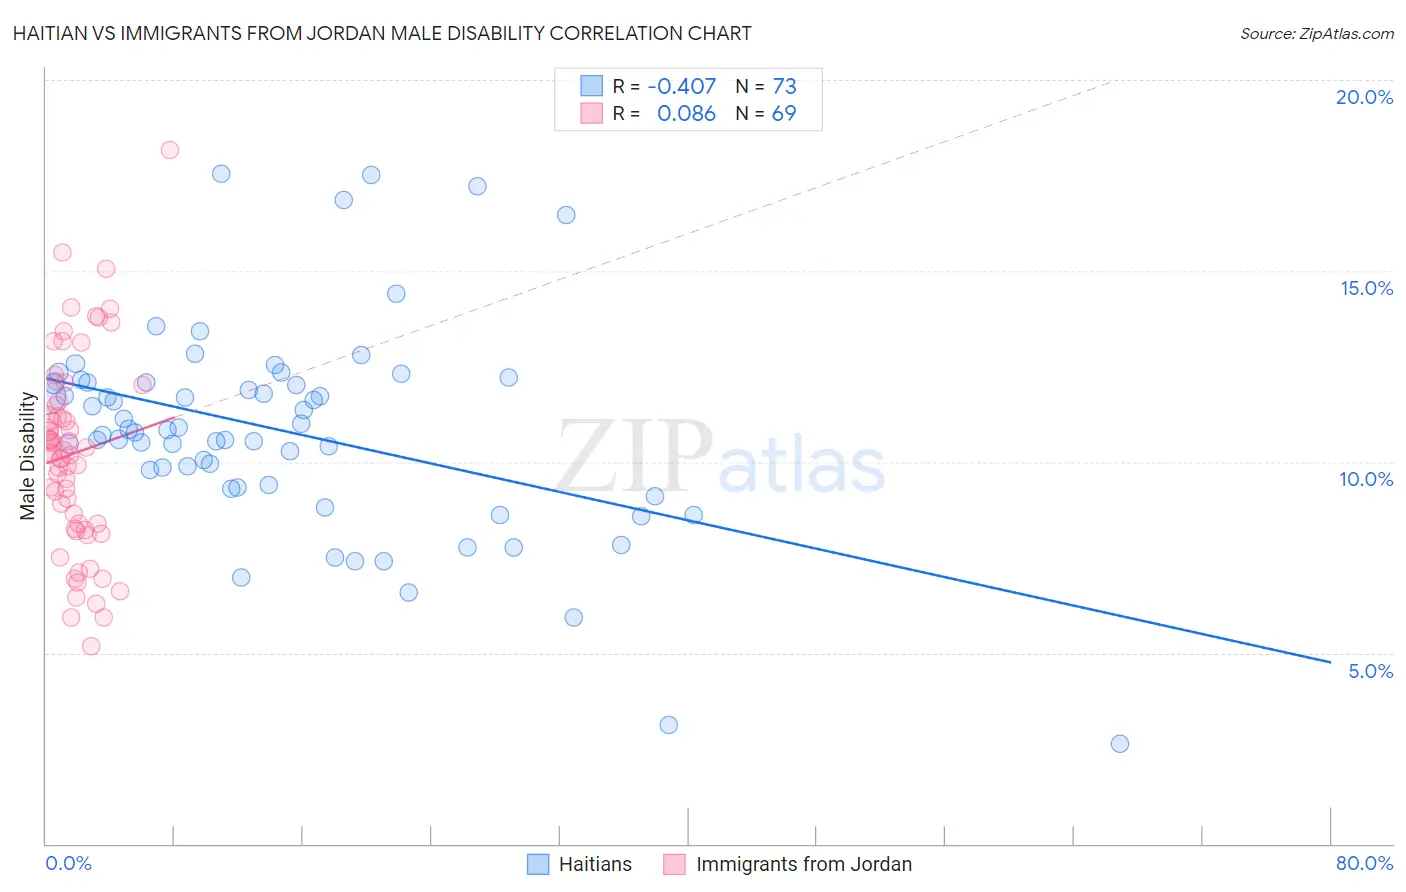
Haitian vs Immigrants from Jordan Male Disability Correlation Chart
The statistical analysis conducted on geographies consisting of 287,906,859 people shows a moderate negative correlation between the proportion of Haitians and percentage of males with a disability in the United States with a correlation coefficient (R) of -0.407 and weighted average of 11.2%. Similarly, the statistical analysis conducted on geographies consisting of 181,276,340 people shows a slight positive correlation between the proportion of Immigrants from Jordan and percentage of males with a disability in the United States with a correlation coefficient (R) of 0.086 and weighted average of 10.6%, a difference of 5.9%.
Male Disability Correlation Summary
| Measurement | Haitian | Immigrants from Jordan |
| Minimum | 2.6% | 5.2% |
| Maximum | 17.5% | 18.2% |
| Range | 14.9% | 13.0% |
| Mean | 10.8% | 10.2% |
| Median | 10.8% | 10.2% |
| Interquartile 25% (IQ1) | 9.4% | 8.3% |
| Interquartile 75% (IQ3) | 12.1% | 11.5% |
| Interquartile Range (IQR) | 2.7% | 3.2% |
| Standard Deviation (Sample) | 2.8% | 2.5% |
| Standard Deviation (Population) | 2.7% | 2.5% |
Similar Demographics by Male Disability
Demographics Similar to Haitians by Male Disability
In terms of male disability, the demographic groups most similar to Haitians are New Zealander (11.2%, a difference of 0.020%), Barbadian (11.2%, a difference of 0.050%), Immigrants from Latin America (11.2%, a difference of 0.080%), Immigrants from Southern Europe (11.2%, a difference of 0.10%), and Romanian (11.2%, a difference of 0.10%).
| Demographics | Rating | Rank | Male Disability |
| British West Indians | 62.8 /100 | #164 | Good 11.1% |
| Luxembourgers | 61.9 /100 | #165 | Good 11.1% |
| Immigrants | Hungary | 61.2 /100 | #166 | Good 11.1% |
| Immigrants | Southern Europe | 54.4 /100 | #167 | Average 11.2% |
| Immigrants | Latin America | 54.0 /100 | #168 | Average 11.2% |
| Barbadians | 53.4 /100 | #169 | Average 11.2% |
| New Zealanders | 52.9 /100 | #170 | Average 11.2% |
| Haitians | 52.5 /100 | #171 | Average 11.2% |
| Romanians | 50.7 /100 | #172 | Average 11.2% |
| Immigrants | Burma/Myanmar | 50.4 /100 | #173 | Average 11.2% |
| Maltese | 50.0 /100 | #174 | Average 11.2% |
| Immigrants | Honduras | 48.7 /100 | #175 | Average 11.2% |
| Syrians | 46.6 /100 | #176 | Average 11.2% |
| Immigrants | Norway | 44.2 /100 | #177 | Average 11.3% |
| Australians | 42.2 /100 | #178 | Average 11.3% |
Demographics Similar to Immigrants from Jordan by Male Disability
In terms of male disability, the demographic groups most similar to Immigrants from Jordan are Zimbabwean (10.6%, a difference of 0.020%), Immigrants from Chile (10.6%, a difference of 0.060%), Immigrants from Guyana (10.6%, a difference of 0.13%), Immigrants from Poland (10.6%, a difference of 0.19%), and Bulgarian (10.6%, a difference of 0.20%).
| Demographics | Rating | Rank | Male Disability |
| Immigrants | Lithuania | 98.9 /100 | #73 | Exceptional 10.5% |
| Immigrants | Lebanon | 98.8 /100 | #74 | Exceptional 10.5% |
| Sierra Leoneans | 98.7 /100 | #75 | Exceptional 10.5% |
| Immigrants | Sierra Leone | 98.7 /100 | #76 | Exceptional 10.5% |
| Laotians | 98.6 /100 | #77 | Exceptional 10.6% |
| Immigrants | Russia | 98.6 /100 | #78 | Exceptional 10.6% |
| Zimbabweans | 98.4 /100 | #79 | Exceptional 10.6% |
| Immigrants | Jordan | 98.4 /100 | #80 | Exceptional 10.6% |
| Immigrants | Chile | 98.3 /100 | #81 | Exceptional 10.6% |
| Immigrants | Guyana | 98.2 /100 | #82 | Exceptional 10.6% |
| Immigrants | Poland | 98.1 /100 | #83 | Exceptional 10.6% |
| Bulgarians | 98.1 /100 | #84 | Exceptional 10.6% |
| Sri Lankans | 97.9 /100 | #85 | Exceptional 10.6% |
| Immigrants | Ireland | 97.9 /100 | #86 | Exceptional 10.6% |
| Immigrants | Vietnam | 97.9 /100 | #87 | Exceptional 10.6% |