German vs Paiute Female Disability
COMPARE
German
Paiute
Female Disability
Female Disability Comparison
Germans
Paiute
12.9%
FEMALE DISABILITY
0.1/ 100
METRIC RATING
272nd/ 347
METRIC RANK
14.0%
FEMALE DISABILITY
0.0/ 100
METRIC RATING
318th/ 347
METRIC RANK
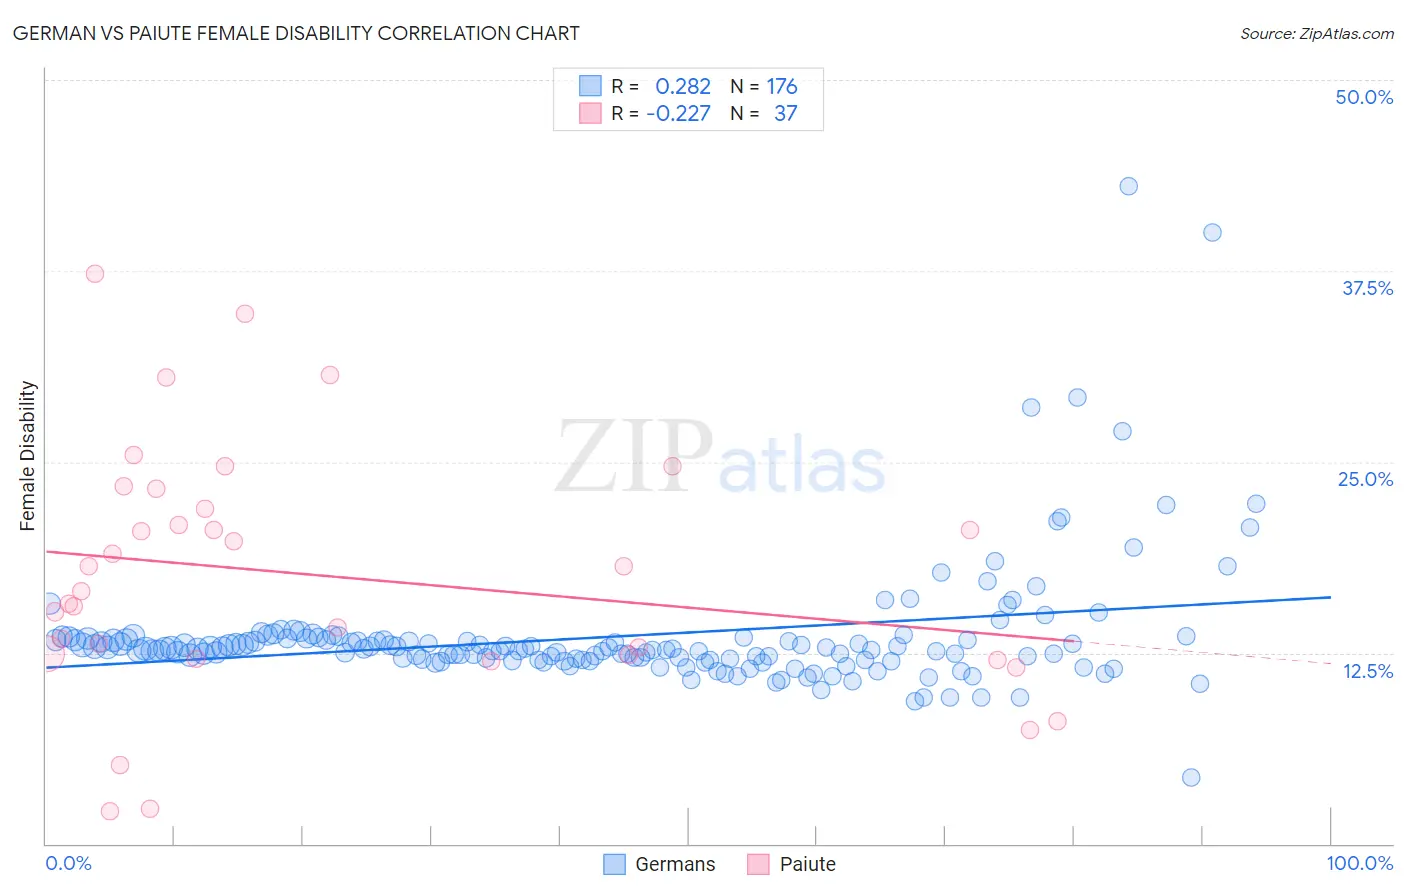
German vs Paiute Female Disability Correlation Chart
The statistical analysis conducted on geographies consisting of 580,718,272 people shows a weak positive correlation between the proportion of Germans and percentage of females with a disability in the United States with a correlation coefficient (R) of 0.282 and weighted average of 12.9%. Similarly, the statistical analysis conducted on geographies consisting of 58,394,614 people shows a weak negative correlation between the proportion of Paiute and percentage of females with a disability in the United States with a correlation coefficient (R) of -0.227 and weighted average of 14.0%, a difference of 8.2%.
Female Disability Correlation Summary
| Measurement | German | Paiute |
| Minimum | 4.3% | 2.1% |
| Maximum | 43.0% | 37.3% |
| Range | 38.7% | 35.2% |
| Mean | 13.6% | 17.5% |
| Median | 12.7% | 16.5% |
| Interquartile 25% (IQ1) | 12.1% | 12.2% |
| Interquartile 75% (IQ3) | 13.4% | 22.6% |
| Interquartile Range (IQR) | 1.3% | 10.3% |
| Standard Deviation (Sample) | 4.2% | 8.2% |
| Standard Deviation (Population) | 4.2% | 8.1% |
Similar Demographics by Female Disability
Demographics Similar to Germans by Female Disability
In terms of female disability, the demographic groups most similar to Germans are Sioux (12.9%, a difference of 0.020%), Portuguese (13.0%, a difference of 0.14%), Cheyenne (13.0%, a difference of 0.19%), Dutch (12.9%, a difference of 0.21%), and Immigrants from Dominica (13.0%, a difference of 0.24%).
| Demographics | Rating | Rank | Female Disability |
| West Indians | 0.5 /100 | #265 | Tragic 12.8% |
| Finns | 0.4 /100 | #266 | Tragic 12.8% |
| Senegalese | 0.4 /100 | #267 | Tragic 12.8% |
| Immigrants | Laos | 0.4 /100 | #268 | Tragic 12.8% |
| Indonesians | 0.4 /100 | #269 | Tragic 12.8% |
| Immigrants | Liberia | 0.3 /100 | #270 | Tragic 12.9% |
| Dutch | 0.2 /100 | #271 | Tragic 12.9% |
| Germans | 0.1 /100 | #272 | Tragic 12.9% |
| Sioux | 0.1 /100 | #273 | Tragic 12.9% |
| Portuguese | 0.1 /100 | #274 | Tragic 13.0% |
| Cheyenne | 0.1 /100 | #275 | Tragic 13.0% |
| Immigrants | Dominica | 0.1 /100 | #276 | Tragic 13.0% |
| Spanish | 0.1 /100 | #277 | Tragic 13.0% |
| Scottish | 0.1 /100 | #278 | Tragic 13.0% |
| Arapaho | 0.1 /100 | #279 | Tragic 13.0% |
Demographics Similar to Paiute by Female Disability
In terms of female disability, the demographic groups most similar to Paiute are Chippewa (14.0%, a difference of 0.11%), Spanish American (14.0%, a difference of 0.22%), Iroquois (14.0%, a difference of 0.29%), Alaskan Athabascan (13.9%, a difference of 0.58%), and American (14.1%, a difference of 0.63%).
| Demographics | Rating | Rank | Female Disability |
| Hopi | 0.0 /100 | #311 | Tragic 13.7% |
| Delaware | 0.0 /100 | #312 | Tragic 13.8% |
| Blackfeet | 0.0 /100 | #313 | Tragic 13.8% |
| Puget Sound Salish | 0.0 /100 | #314 | Tragic 13.8% |
| Alaskan Athabascans | 0.0 /100 | #315 | Tragic 13.9% |
| Spanish Americans | 0.0 /100 | #316 | Tragic 14.0% |
| Chippewa | 0.0 /100 | #317 | Tragic 14.0% |
| Paiute | 0.0 /100 | #318 | Tragic 14.0% |
| Iroquois | 0.0 /100 | #319 | Tragic 14.0% |
| Americans | 0.0 /100 | #320 | Tragic 14.1% |
| Potawatomi | 0.0 /100 | #321 | Tragic 14.1% |
| Pueblo | 0.0 /100 | #322 | Tragic 14.1% |
| Blacks/African Americans | 0.0 /100 | #323 | Tragic 14.1% |
| Natives/Alaskans | 0.0 /100 | #324 | Tragic 14.1% |
| Navajo | 0.0 /100 | #325 | Tragic 14.2% |