French Canadian vs Irish Female Disability
COMPARE
French Canadian
Irish
Female Disability
Female Disability Comparison
French Canadians
Irish
13.6%
FEMALE DISABILITY
0.0/ 100
METRIC RATING
306th/ 347
METRIC RANK
13.1%
FEMALE DISABILITY
0.1/ 100
METRIC RATING
280th/ 347
METRIC RANK
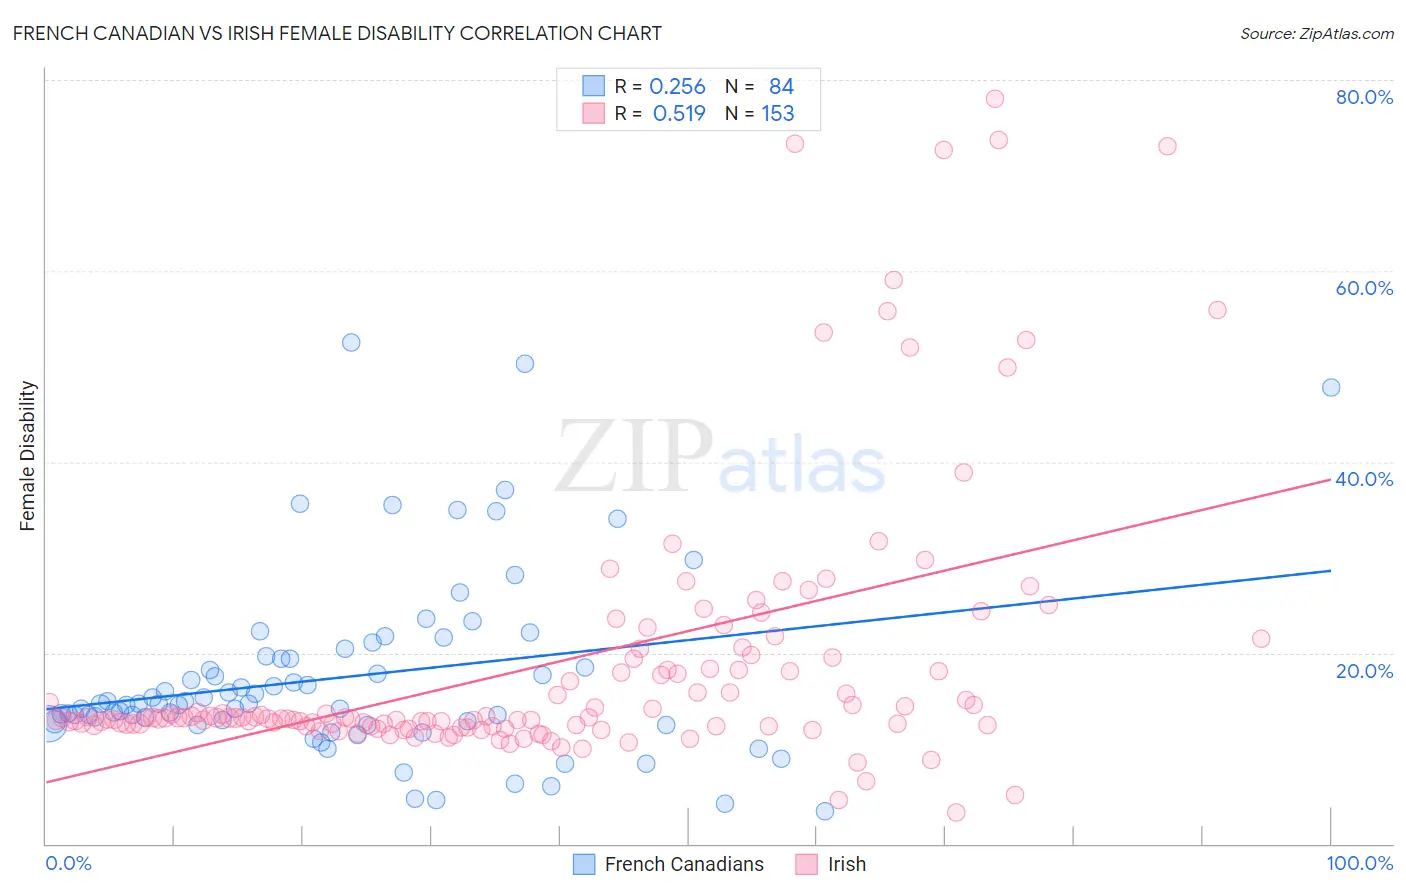
French Canadian vs Irish Female Disability Correlation Chart
The statistical analysis conducted on geographies consisting of 502,526,551 people shows a weak positive correlation between the proportion of French Canadians and percentage of females with a disability in the United States with a correlation coefficient (R) of 0.256 and weighted average of 13.6%. Similarly, the statistical analysis conducted on geographies consisting of 580,159,528 people shows a substantial positive correlation between the proportion of Irish and percentage of females with a disability in the United States with a correlation coefficient (R) of 0.519 and weighted average of 13.1%, a difference of 4.0%.
Female Disability Correlation Summary
| Measurement | French Canadian | Irish |
| Minimum | 3.4% | 3.2% |
| Maximum | 52.5% | 78.1% |
| Range | 49.1% | 74.9% |
| Mean | 17.5% | 18.7% |
| Median | 14.7% | 13.2% |
| Interquartile 25% (IQ1) | 12.7% | 12.4% |
| Interquartile 75% (IQ3) | 19.5% | 18.3% |
| Interquartile Range (IQR) | 6.8% | 5.9% |
| Standard Deviation (Sample) | 9.7% | 14.2% |
| Standard Deviation (Population) | 9.6% | 14.1% |
Similar Demographics by Female Disability
Demographics Similar to French Canadians by Female Disability
In terms of female disability, the demographic groups most similar to French Canadians are Central American Indian (13.6%, a difference of 0.29%), Dominican (13.5%, a difference of 0.63%), Cree (13.7%, a difference of 0.75%), French American Indian (13.7%, a difference of 0.81%), and Apache (13.7%, a difference of 0.93%).
| Demographics | Rating | Rank | Female Disability |
| Immigrants | Dominican Republic | 0.0 /100 | #299 | Tragic 13.4% |
| Pennsylvania Germans | 0.0 /100 | #300 | Tragic 13.4% |
| Africans | 0.0 /100 | #301 | Tragic 13.4% |
| Scotch-Irish | 0.0 /100 | #302 | Tragic 13.4% |
| Immigrants | Portugal | 0.0 /100 | #303 | Tragic 13.5% |
| Immigrants | Micronesia | 0.0 /100 | #304 | Tragic 13.5% |
| Dominicans | 0.0 /100 | #305 | Tragic 13.5% |
| French Canadians | 0.0 /100 | #306 | Tragic 13.6% |
| Central American Indians | 0.0 /100 | #307 | Tragic 13.6% |
| Cree | 0.0 /100 | #308 | Tragic 13.7% |
| French American Indians | 0.0 /100 | #309 | Tragic 13.7% |
| Apache | 0.0 /100 | #310 | Tragic 13.7% |
| Hopi | 0.0 /100 | #311 | Tragic 13.7% |
| Delaware | 0.0 /100 | #312 | Tragic 13.8% |
| Blackfeet | 0.0 /100 | #313 | Tragic 13.8% |
Demographics Similar to Irish by Female Disability
In terms of female disability, the demographic groups most similar to Irish are U.S. Virgin Islander (13.1%, a difference of 0.030%), Arapaho (13.0%, a difference of 0.090%), Welsh (13.1%, a difference of 0.11%), English (13.1%, a difference of 0.12%), and Hmong (13.1%, a difference of 0.25%).
| Demographics | Rating | Rank | Female Disability |
| Sioux | 0.1 /100 | #273 | Tragic 12.9% |
| Portuguese | 0.1 /100 | #274 | Tragic 13.0% |
| Cheyenne | 0.1 /100 | #275 | Tragic 13.0% |
| Immigrants | Dominica | 0.1 /100 | #276 | Tragic 13.0% |
| Spanish | 0.1 /100 | #277 | Tragic 13.0% |
| Scottish | 0.1 /100 | #278 | Tragic 13.0% |
| Arapaho | 0.1 /100 | #279 | Tragic 13.0% |
| Irish | 0.1 /100 | #280 | Tragic 13.1% |
| U.S. Virgin Islanders | 0.1 /100 | #281 | Tragic 13.1% |
| Welsh | 0.0 /100 | #282 | Tragic 13.1% |
| English | 0.0 /100 | #283 | Tragic 13.1% |
| Hmong | 0.0 /100 | #284 | Tragic 13.1% |
| Bangladeshis | 0.0 /100 | #285 | Tragic 13.1% |
| Fijians | 0.0 /100 | #286 | Tragic 13.1% |
| Yaqui | 0.0 /100 | #287 | Tragic 13.2% |