Czech vs Immigrants from Australia Female Disability

COMPARE

Czech
Race
Ancestry
AfghanAfricanAlaska NativeAlaskan AthabascanAlbanianAleutAlsatianAmericanApacheArabArapahoArgentineanArmenianAssyrian/Chaldean/SyriacAustralianAustrianBahamianBangladeshiBarbadianBasqueBelgianBelizeanBermudanBhutaneseBlackfeetBolivianBrazilianBritishBritish West IndianBulgarianBurmeseCajunCambodianCanadianCape VerdeanCarpatho RusynCelticCentral AmericanCentral American IndianCherokeeCheyenneChickasawChileanChineseChippewaChoctawColombianColvilleComancheCosta RicanCreeCreekCroatianCrowCubanCypriotCzechCzechoslovakianDanishDelawareDominicanDutchDutch West IndianEastern EuropeanEcuadorianEgyptianEnglishEstonianEthiopianEuropeanFijianFilipinoFinnishFrenchFrench American IndianFrench CanadianGermanGerman RussianGhanaianGreekGuamanian/ChamorroGuatemalanGuyaneseHaitianHmongHonduranHopiHoumaHungarianIcelanderIndian (Asian)IndonesianInupiatIranianIraqiIrishIroquoisIsraeliItalianJamaicanJapaneseJordanianKenyanKiowaKoreanLaotianLatvianLebaneseLiberianLithuanianLumbeeLuxembourgerMacedonianMalaysianMalteseMarshalleseMenomineeMexicanMexican American IndianMongolianMoroccanNative HawaiianNavajoNepaleseNew ZealanderNicaraguanNigerianNorthern EuropeanNorwegianOkinawanOsageOttawaPaiutePakistaniPalestinianPanamanianParaguayanPennsylvania GermanPeruvianPimaPolishPortuguesePotawatomiPuebloPuerto RicanPuget Sound SalishRomanianRussianSalvadoranSamoanScandinavianScotch-IrishScottishSeminoleSenegaleseSerbianShoshoneSierra LeoneanSiouxSlavicSlovakSloveneSomaliSouth AfricanSouth AmericanSouth American IndianSoviet UnionSpaniardSpanishSpanish AmericanSpanish American IndianSri LankanSubsaharan AfricanSudaneseSwedishSwissSyrianTaiwaneseThaiTlingit-HaidaTohono O'OdhamTonganTrinidadian and TobagonianTsimshianTurkishU.S. Virgin IslanderUgandanUkrainianUruguayanUteVenezuelanVietnameseWelshWest IndianYakamaYaquiYugoslavianYumanYup'ikZimbabwean
Immigration
NonimmigrantsImmigrantsAfghanistanAfricaAlbaniaArgentinaArmeniaAsiaAustriaBahamasBangladeshBarbadosBelarusBelgiumBelizeBoliviaBosnia and HerzegovinaBrazilBulgariaBurma/MyanmarCabo VerdeCambodiaCameroonCanadaCaribbeanCentral AmericaChileChinaColombiaCongoCosta RicaCroatiaCubaCzechoslovakiaDenmarkDominicaDominican RepublicEastern AfricaEastern AsiaEastern EuropeEcuadorEgyptEl SalvadorEnglandEritreaEthiopiaEuropeFijiFranceGermanyGhanaGreeceGrenadaGuatemalaGuyanaHaitiHondurasHong KongHungaryIndiaIndonesiaIranIraqIrelandIsraelItalyJamaicaJapanJordanKazakhstanKenyaKoreaKuwaitLaosLatin AmericaLatviaLebanonLiberiaLithuaniaMalaysiaMexicoMicronesiaMiddle AfricaMoldovaMoroccoNepalNetherlandsNicaraguaNigeriaNorth AmericaNorth MacedoniaNorthern AfricaNorthern EuropeNorwayOceaniaPakistanPanamaPeruPhilippinesPolandPortugalRomaniaRussiaSaudi ArabiaScotlandSenegalSerbiaSierra LeoneSingaporeSomaliaSouth AfricaSouth AmericaSouth Central AsiaSouth Eastern AsiaSouthern EuropeSpainSri LankaSt. Vincent and the GrenadinesSudanSwedenSwitzerlandSyriaTaiwanThailandTrinidad and TobagoTurkeyUgandaUkraineUruguayUzbekistanVenezuelaVietnamWest IndiesWestern AfricaWestern AsiaWestern EuropeYemenZaireZimbabweAzores
Immigrants from Australia
Race
Ancestry
AfghanAfricanAlaska NativeAlaskan AthabascanAlbanianAleutAlsatianAmericanApacheArabArapahoArgentineanArmenianAssyrian/Chaldean/SyriacAustralianAustrianBahamianBangladeshiBarbadianBasqueBelgianBelizeanBermudanBhutaneseBlackfeetBolivianBrazilianBritishBritish West IndianBulgarianBurmeseCajunCambodianCanadianCape VerdeanCarpatho RusynCelticCentral AmericanCentral American IndianCherokeeCheyenneChickasawChileanChineseChippewaChoctawColombianColvilleComancheCosta RicanCreeCreekCroatianCrowCubanCypriotCzechoslovakianDanishDelawareDominicanDutchDutch West IndianEastern EuropeanEcuadorianEgyptianEnglishEstonianEthiopianEuropeanFijianFilipinoFinnishFrenchFrench American IndianFrench CanadianGermanGerman RussianGhanaianGreekGuamanian/ChamorroGuatemalanGuyaneseHaitianHmongHonduranHopiHoumaHungarianIcelanderIndian (Asian)IndonesianInupiatIranianIraqiIrishIroquoisIsraeliItalianJamaicanJapaneseJordanianKenyanKiowaKoreanLaotianLatvianLebaneseLiberianLithuanianLumbeeLuxembourgerMacedonianMalaysianMalteseMarshalleseMenomineeMexicanMexican American IndianMongolianMoroccanNative HawaiianNavajoNepaleseNew ZealanderNicaraguanNigerianNorthern EuropeanNorwegianOkinawanOsageOttawaPaiutePakistaniPalestinianPanamanianParaguayanPennsylvania GermanPeruvianPimaPolishPortuguesePotawatomiPuebloPuerto RicanPuget Sound SalishRomanianRussianSalvadoranSamoanScandinavianScotch-IrishScottishSeminoleSenegaleseSerbianShoshoneSierra LeoneanSiouxSlavicSlovakSloveneSomaliSouth AfricanSouth AmericanSouth American IndianSoviet UnionSpaniardSpanishSpanish AmericanSpanish American IndianSri LankanSubsaharan AfricanSudaneseSwedishSwissSyrianTaiwaneseThaiTlingit-HaidaTohono O'OdhamTonganTrinidadian and TobagonianTsimshianTurkishU.S. Virgin IslanderUgandanUkrainianUruguayanUteVenezuelanVietnameseWelshWest IndianYakamaYaquiYugoslavianYumanYup'ikZimbabwean
Immigration
NonimmigrantsImmigrantsAfghanistanAfricaAlbaniaArgentinaArmeniaAsiaAustraliaAustriaBahamasBangladeshBarbadosBelarusBelgiumBelizeBoliviaBosnia and HerzegovinaBrazilBulgariaBurma/MyanmarCabo VerdeCambodiaCameroonCanadaCaribbeanCentral AmericaChileChinaColombiaCongoCosta RicaCroatiaCubaCzechoslovakiaDenmarkDominicaDominican RepublicEastern AfricaEastern AsiaEastern EuropeEcuadorEgyptEl SalvadorEnglandEritreaEthiopiaEuropeFijiFranceGermanyGhanaGreeceGrenadaGuatemalaGuyanaHaitiHondurasHong KongHungaryIndiaIndonesiaIranIraqIrelandIsraelItalyJamaicaJapanJordanKazakhstanKenyaKoreaKuwaitLaosLatin AmericaLatviaLebanonLiberiaLithuaniaMalaysiaMexicoMicronesiaMiddle AfricaMoldovaMoroccoNepalNetherlandsNicaraguaNigeriaNorth AmericaNorth MacedoniaNorthern AfricaNorthern EuropeNorwayOceaniaPakistanPanamaPeruPhilippinesPolandPortugalRomaniaRussiaSaudi ArabiaScotlandSenegalSerbiaSierra LeoneSingaporeSomaliaSouth AfricaSouth AmericaSouth Central AsiaSouth Eastern AsiaSouthern EuropeSpainSri LankaSt. Vincent and the GrenadinesSudanSwedenSwitzerlandSyriaTaiwanThailandTrinidad and TobagoTurkeyUgandaUkraineUruguayUzbekistanVenezuelaVietnamWest IndiesWestern AfricaWestern AsiaWestern EuropeYemenZaireZimbabweAzores
Female Disability
Income
Poverty
Unemployment
Labor Participation
Family Structure
Vehicle Availability
Education Level
Disability

Female Disability Comparison

Czechs

Immigrants from Australia

Good
Exceptional
12.1%
FEMALE DISABILITY
63.6/ 100
METRIC RATING
164th/ 347
METRIC RANK
11.1%
FEMALE DISABILITY
100.0/ 100
METRIC RATING
32nd/ 347
METRIC RANK

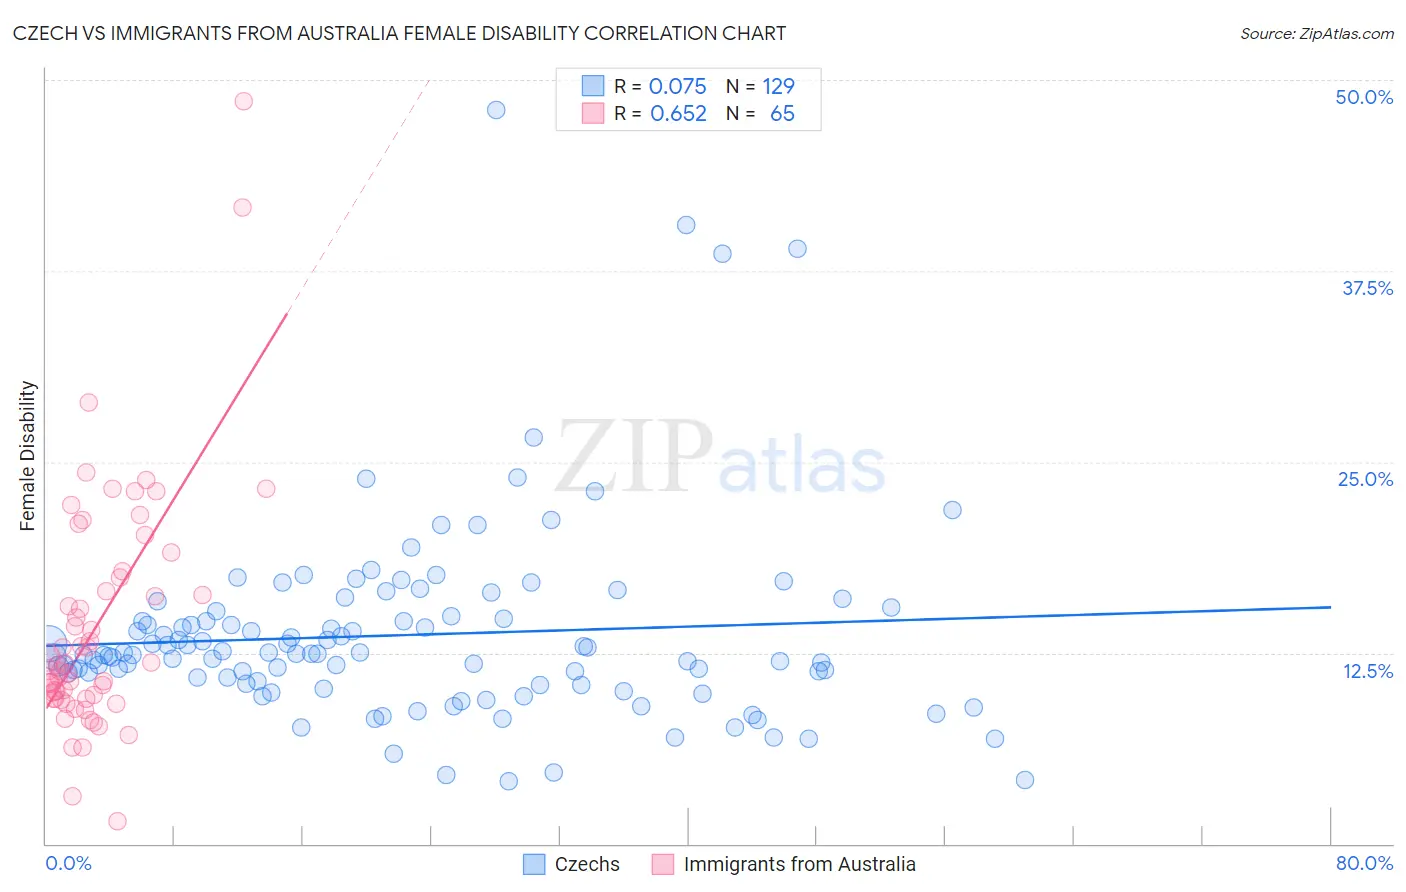
Czech vs Immigrants from Australia Female Disability Correlation Chart

The statistical analysis conducted on geographies consisting of 484,697,758 people shows a slight positive correlation between the proportion of Czechs and percentage of females with a disability in the United States with a correlation coefficient (R) of 0.075 and weighted average of 12.1%. Similarly, the statistical analysis conducted on geographies consisting of 227,197,779 people shows a significant positive correlation between the proportion of Immigrants from Australia and percentage of females with a disability in the United States with a correlation coefficient (R) of 0.652 and weighted average of 11.1%, a difference of 9.0%.
Czech vs Immigrants from Australia Female Disability

Female Disability Correlation Summary

MeasurementCzechImmigrants from Australia
Minimum4.1%1.4%
Maximum48.0%48.6%
Range43.9%47.1%
Mean13.7%14.3%
Median12.5%11.7%
Interquartile 25% (IQ1)10.6%9.5%
Interquartile 75% (IQ3)14.8%17.7%
Interquartile Range (IQR)4.3%8.1%
Standard Deviation (Sample)6.4%7.9%
Standard Deviation (Population)6.4%7.9%

Similar Demographics by Female Disability

Demographics Similar to Czechs by Female Disability

In terms of female disability, the demographic groups most similar to Czechs are Guatemalan (12.1%, a difference of 0.010%), Immigrants from Ukraine (12.1%, a difference of 0.030%), Guyanese (12.1%, a difference of 0.040%), Immigrants from Oceania (12.1%, a difference of 0.070%), and Immigrants from Guatemala (12.1%, a difference of 0.10%).
DemographicsRating | RankFemale Disability
Danes
72.5
/100
|
#157
Good
12.1%
Immigrants | Middle Africa
72.4
/100
|
#158
Good
12.1%
Immigrants | Central America
67.7
/100
|
#159
Good
12.1%
Immigrants | Guatemala
66.0
/100
|
#160
Good
12.1%
Guyanese
64.7
/100
|
#161
Good
12.1%
Immigrants | Ukraine
64.3
/100
|
#162
Good
12.1%
Guatemalans
63.8
/100
|
#163
Good
12.1%
Czechs
63.6
/100
|
#164
Good
12.1%
Immigrants | Oceania
61.8
/100
|
#165
Good
12.1%
Lithuanians
59.5
/100
|
#166
Average
12.2%
Immigrants | Latin America
59.0
/100
|
#167
Average
12.2%
Immigrants | Haiti
58.8
/100
|
#168
Average
12.2%
Lebanese
58.1
/100
|
#169
Average
12.2%
Maltese
57.0
/100
|
#170
Average
12.2%
Immigrants | Southern Europe
56.3
/100
|
#171
Average
12.2%

Demographics Similar to Immigrants from Australia by Female Disability

In terms of female disability, the demographic groups most similar to Immigrants from Australia are Immigrants from Egypt (11.1%, a difference of 0.080%), Immigrants from Kuwait (11.1%, a difference of 0.17%), Immigrants from Malaysia (11.1%, a difference of 0.27%), Turkish (11.1%, a difference of 0.27%), and Egyptian (11.1%, a difference of 0.33%).
DemographicsRating | RankFemale Disability
Immigrants | Asia
100.0
/100
|
#25
Exceptional
11.0%
Argentineans
100.0
/100
|
#26
Exceptional
11.0%
Immigrants | Turkey
100.0
/100
|
#27
Exceptional
11.1%
Egyptians
100.0
/100
|
#28
Exceptional
11.1%
Immigrants | Malaysia
100.0
/100
|
#29
Exceptional
11.1%
Turks
100.0
/100
|
#30
Exceptional
11.1%
Immigrants | Kuwait
100.0
/100
|
#31
Exceptional
11.1%
Immigrants | Australia
100.0
/100
|
#32
Exceptional
11.1%
Immigrants | Egypt
100.0
/100
|
#33
Exceptional
11.1%
Immigrants | Indonesia
100.0
/100
|
#34
Exceptional
11.2%
Immigrants | Japan
100.0
/100
|
#35
Exceptional
11.2%
Cypriots
100.0
/100
|
#36
Exceptional
11.2%
Ethiopians
100.0
/100
|
#37
Exceptional
11.2%
Immigrants | Ethiopia
100.0
/100
|
#38
Exceptional
11.2%
Immigrants | Lithuania
100.0
/100
|
#39
Exceptional
11.2%