Bulgarian vs Immigrants from Belgium Male Disability
COMPARE
Bulgarian
Immigrants from Belgium
Male Disability
Male Disability Comparison
Bulgarians
Immigrants from Belgium
10.6%
MALE DISABILITY
98.1/ 100
METRIC RATING
84th/ 347
METRIC RANK
10.8%
MALE DISABILITY
94.2/ 100
METRIC RATING
108th/ 347
METRIC RANK
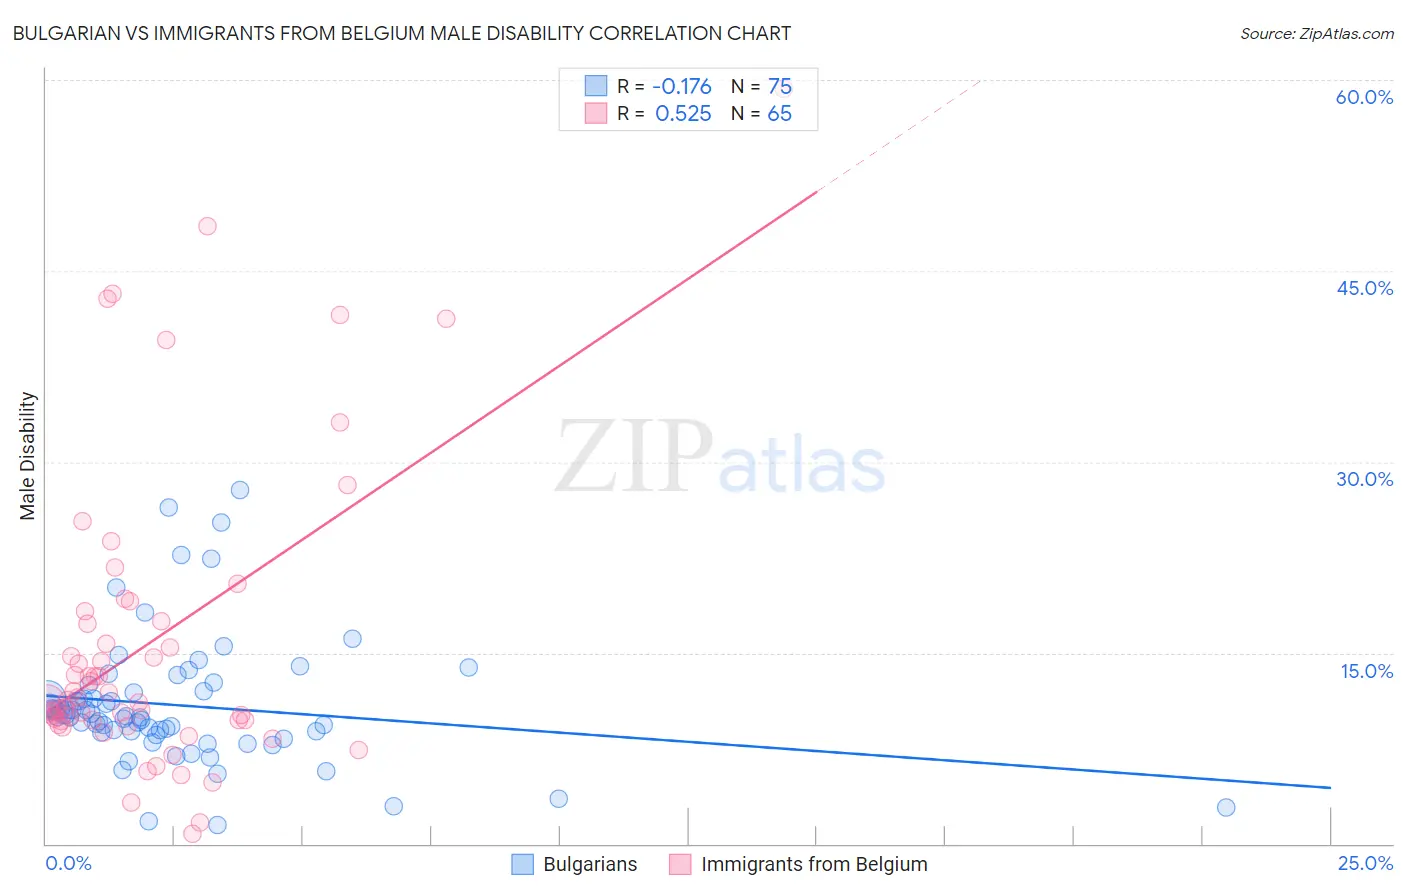
Bulgarian vs Immigrants from Belgium Male Disability Correlation Chart
The statistical analysis conducted on geographies consisting of 205,628,995 people shows a poor negative correlation between the proportion of Bulgarians and percentage of males with a disability in the United States with a correlation coefficient (R) of -0.176 and weighted average of 10.6%. Similarly, the statistical analysis conducted on geographies consisting of 146,717,814 people shows a substantial positive correlation between the proportion of Immigrants from Belgium and percentage of males with a disability in the United States with a correlation coefficient (R) of 0.525 and weighted average of 10.8%, a difference of 1.7%.
Male Disability Correlation Summary
| Measurement | Bulgarian | Immigrants from Belgium |
| Minimum | 1.5% | 0.83% |
| Maximum | 27.8% | 59.3% |
| Range | 26.4% | 58.5% |
| Mean | 10.9% | 15.9% |
| Median | 10.0% | 11.3% |
| Interquartile 25% (IQ1) | 8.7% | 9.7% |
| Interquartile 75% (IQ3) | 11.9% | 17.9% |
| Interquartile Range (IQR) | 3.2% | 8.2% |
| Standard Deviation (Sample) | 5.0% | 11.9% |
| Standard Deviation (Population) | 5.0% | 11.8% |
Similar Demographics by Male Disability
Demographics Similar to Bulgarians by Male Disability
In terms of male disability, the demographic groups most similar to Bulgarians are Immigrants from Poland (10.6%, a difference of 0.010%), Immigrants from Guyana (10.6%, a difference of 0.080%), Immigrants from Chile (10.6%, a difference of 0.14%), Sri Lankan (10.6%, a difference of 0.18%), and Immigrants from Ireland (10.6%, a difference of 0.18%).
| Demographics | Rating | Rank | Male Disability |
| Laotians | 98.6 /100 | #77 | Exceptional 10.6% |
| Immigrants | Russia | 98.6 /100 | #78 | Exceptional 10.6% |
| Zimbabweans | 98.4 /100 | #79 | Exceptional 10.6% |
| Immigrants | Jordan | 98.4 /100 | #80 | Exceptional 10.6% |
| Immigrants | Chile | 98.3 /100 | #81 | Exceptional 10.6% |
| Immigrants | Guyana | 98.2 /100 | #82 | Exceptional 10.6% |
| Immigrants | Poland | 98.1 /100 | #83 | Exceptional 10.6% |
| Bulgarians | 98.1 /100 | #84 | Exceptional 10.6% |
| Sri Lankans | 97.9 /100 | #85 | Exceptional 10.6% |
| Immigrants | Ireland | 97.9 /100 | #86 | Exceptional 10.6% |
| Immigrants | Vietnam | 97.9 /100 | #87 | Exceptional 10.6% |
| Immigrants | Western Asia | 97.8 /100 | #88 | Exceptional 10.6% |
| Immigrants | Nicaragua | 97.8 /100 | #89 | Exceptional 10.6% |
| Immigrants | Morocco | 97.7 /100 | #90 | Exceptional 10.6% |
| Immigrants | France | 97.6 /100 | #91 | Exceptional 10.6% |
Demographics Similar to Immigrants from Belgium by Male Disability
In terms of male disability, the demographic groups most similar to Immigrants from Belgium are Immigrants from Eastern Africa (10.8%, a difference of 0.020%), Immigrants from Uganda (10.8%, a difference of 0.050%), Immigrants (10.8%, a difference of 0.080%), Immigrants from Uruguay (10.8%, a difference of 0.11%), and Immigrants from Syria (10.8%, a difference of 0.19%).
| Demographics | Rating | Rank | Male Disability |
| Immigrants | Greece | 95.6 /100 | #101 | Exceptional 10.7% |
| Immigrants | Eastern Europe | 95.3 /100 | #102 | Exceptional 10.7% |
| Uruguayans | 95.3 /100 | #103 | Exceptional 10.7% |
| Immigrants | Nigeria | 95.1 /100 | #104 | Exceptional 10.8% |
| Immigrants | Brazil | 95.0 /100 | #105 | Exceptional 10.8% |
| Immigrants | Syria | 94.9 /100 | #106 | Exceptional 10.8% |
| Immigrants | Eastern Africa | 94.3 /100 | #107 | Exceptional 10.8% |
| Immigrants | Belgium | 94.2 /100 | #108 | Exceptional 10.8% |
| Immigrants | Uganda | 94.0 /100 | #109 | Exceptional 10.8% |
| Immigrants | Immigrants | 93.9 /100 | #110 | Exceptional 10.8% |
| Immigrants | Uruguay | 93.8 /100 | #111 | Exceptional 10.8% |
| Ghanaians | 93.4 /100 | #112 | Exceptional 10.8% |
| Immigrants | Zimbabwe | 93.0 /100 | #113 | Exceptional 10.8% |
| Central Americans | 92.7 /100 | #114 | Exceptional 10.8% |
| Immigrants | Barbados | 92.2 /100 | #115 | Exceptional 10.8% |