Bulgarian vs Immigrants from Belgium Nursery School
COMPARE
Bulgarian
Immigrants from Belgium
Nursery School
Nursery School Comparison
Bulgarians
Immigrants from Belgium
98.4%
NURSERY SCHOOL
99.8/ 100
METRIC RATING
58th/ 347
METRIC RANK
98.3%
NURSERY SCHOOL
99.3/ 100
METRIC RATING
79th/ 347
METRIC RANK
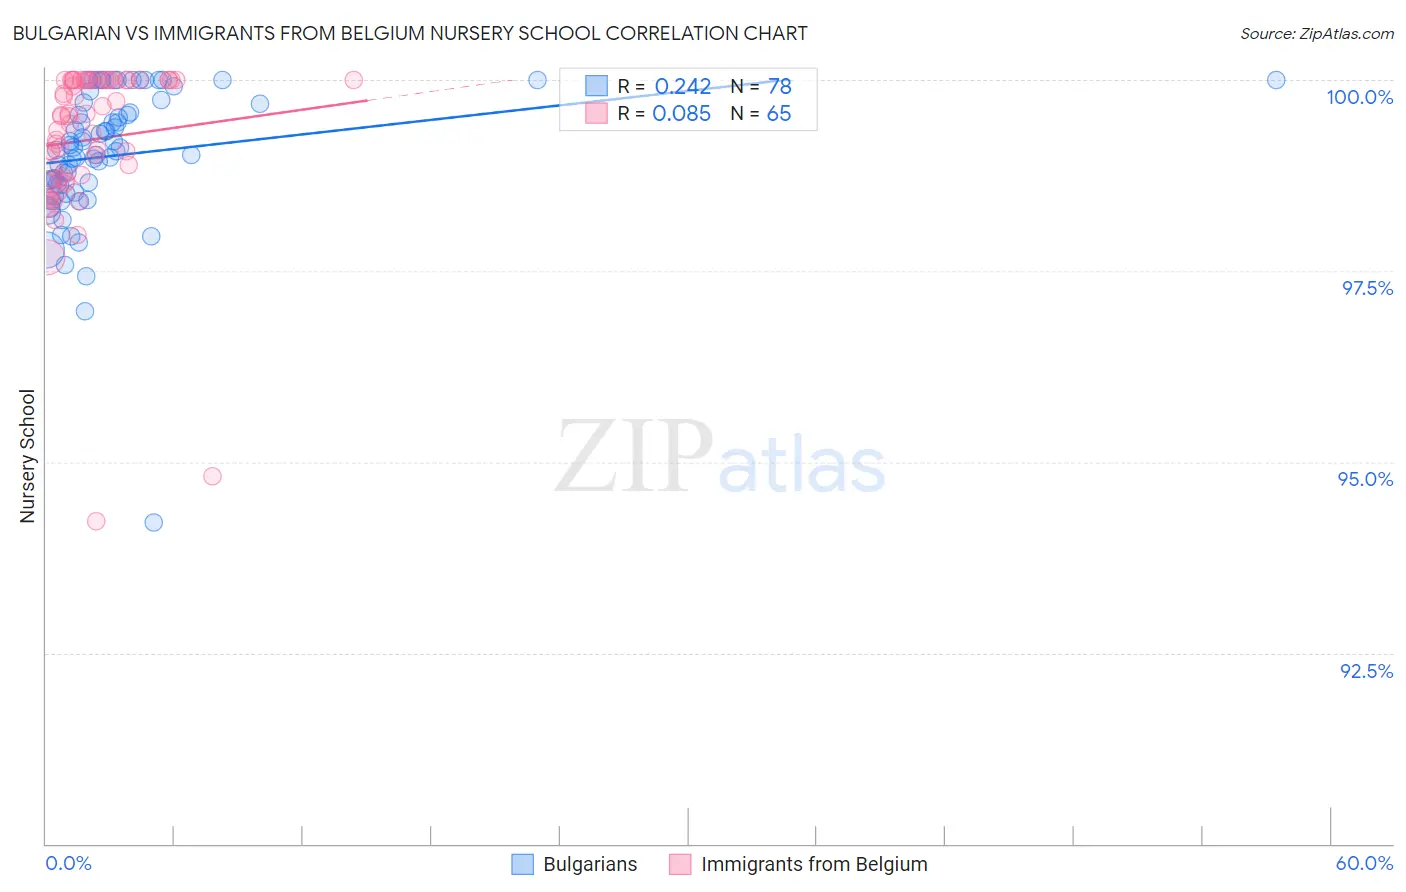
Bulgarian vs Immigrants from Belgium Nursery School Correlation Chart
The statistical analysis conducted on geographies consisting of 205,633,223 people shows a weak positive correlation between the proportion of Bulgarians and percentage of population with at least nursery school education in the United States with a correlation coefficient (R) of 0.242 and weighted average of 98.4%. Similarly, the statistical analysis conducted on geographies consisting of 146,727,969 people shows a slight positive correlation between the proportion of Immigrants from Belgium and percentage of population with at least nursery school education in the United States with a correlation coefficient (R) of 0.085 and weighted average of 98.3%, a difference of 0.090%.
Nursery School Correlation Summary
| Measurement | Bulgarian | Immigrants from Belgium |
| Minimum | 94.2% | 94.2% |
| Maximum | 100.0% | 100.0% |
| Range | 5.8% | 5.8% |
| Mean | 99.0% | 99.2% |
| Median | 99.1% | 99.5% |
| Interquartile 25% (IQ1) | 98.6% | 98.7% |
| Interquartile 75% (IQ3) | 99.7% | 100.0% |
| Interquartile Range (IQR) | 1.1% | 1.3% |
| Standard Deviation (Sample) | 0.90% | 1.1% |
| Standard Deviation (Population) | 0.90% | 1.1% |
Similar Demographics by Nursery School
Demographics Similar to Bulgarians by Nursery School
In terms of nursery school, the demographic groups most similar to Bulgarians are American (98.4%, a difference of 0.0%), Austrian (98.4%, a difference of 0.0%), Immigrants from Canada (98.4%, a difference of 0.0%), Slavic (98.4%, a difference of 0.0%), and Pueblo (98.4%, a difference of 0.010%).
| Demographics | Rating | Rank | Nursery School |
| Estonians | 99.8 /100 | #51 | Exceptional 98.5% |
| Australians | 99.8 /100 | #52 | Exceptional 98.5% |
| Kiowa | 99.8 /100 | #53 | Exceptional 98.4% |
| Pueblo | 99.8 /100 | #54 | Exceptional 98.4% |
| Immigrants | Scotland | 99.8 /100 | #55 | Exceptional 98.4% |
| Americans | 99.8 /100 | #56 | Exceptional 98.4% |
| Austrians | 99.8 /100 | #57 | Exceptional 98.4% |
| Bulgarians | 99.8 /100 | #58 | Exceptional 98.4% |
| Immigrants | Canada | 99.8 /100 | #59 | Exceptional 98.4% |
| Slavs | 99.8 /100 | #60 | Exceptional 98.4% |
| New Zealanders | 99.7 /100 | #61 | Exceptional 98.4% |
| Creek | 99.7 /100 | #62 | Exceptional 98.4% |
| Immigrants | North America | 99.7 /100 | #63 | Exceptional 98.4% |
| Greeks | 99.7 /100 | #64 | Exceptional 98.4% |
| Maltese | 99.7 /100 | #65 | Exceptional 98.4% |
Demographics Similar to Immigrants from Belgium by Nursery School
In terms of nursery school, the demographic groups most similar to Immigrants from Belgium are Cherokee (98.3%, a difference of 0.0%), Immigrants from England (98.3%, a difference of 0.0%), Immigrants from Lithuania (98.3%, a difference of 0.0%), Delaware (98.3%, a difference of 0.0%), and Shoshone (98.3%, a difference of 0.0%).
| Demographics | Rating | Rank | Nursery School |
| Chickasaw | 99.6 /100 | #72 | Exceptional 98.4% |
| Cajuns | 99.4 /100 | #73 | Exceptional 98.4% |
| Immigrants | Netherlands | 99.4 /100 | #74 | Exceptional 98.4% |
| Cherokee | 99.3 /100 | #75 | Exceptional 98.3% |
| Immigrants | England | 99.3 /100 | #76 | Exceptional 98.3% |
| Immigrants | Lithuania | 99.3 /100 | #77 | Exceptional 98.3% |
| Delaware | 99.3 /100 | #78 | Exceptional 98.3% |
| Immigrants | Belgium | 99.3 /100 | #79 | Exceptional 98.3% |
| Shoshone | 99.3 /100 | #80 | Exceptional 98.3% |
| Icelanders | 99.2 /100 | #81 | Exceptional 98.3% |
| Potawatomi | 99.2 /100 | #82 | Exceptional 98.3% |
| Osage | 99.1 /100 | #83 | Exceptional 98.3% |
| Immigrants | Denmark | 99.1 /100 | #84 | Exceptional 98.3% |
| Immigrants | Sweden | 99.1 /100 | #85 | Exceptional 98.3% |
| Immigrants | Australia | 99.0 /100 | #86 | Exceptional 98.3% |