Immigrants from Morocco vs Immigrants from Belgium Male Disability
COMPARE
Immigrants from Morocco
Immigrants from Belgium
Male Disability
Male Disability Comparison
Immigrants from Morocco
Immigrants from Belgium
10.6%
MALE DISABILITY
97.7/ 100
METRIC RATING
90th/ 347
METRIC RANK
10.8%
MALE DISABILITY
94.2/ 100
METRIC RATING
108th/ 347
METRIC RANK
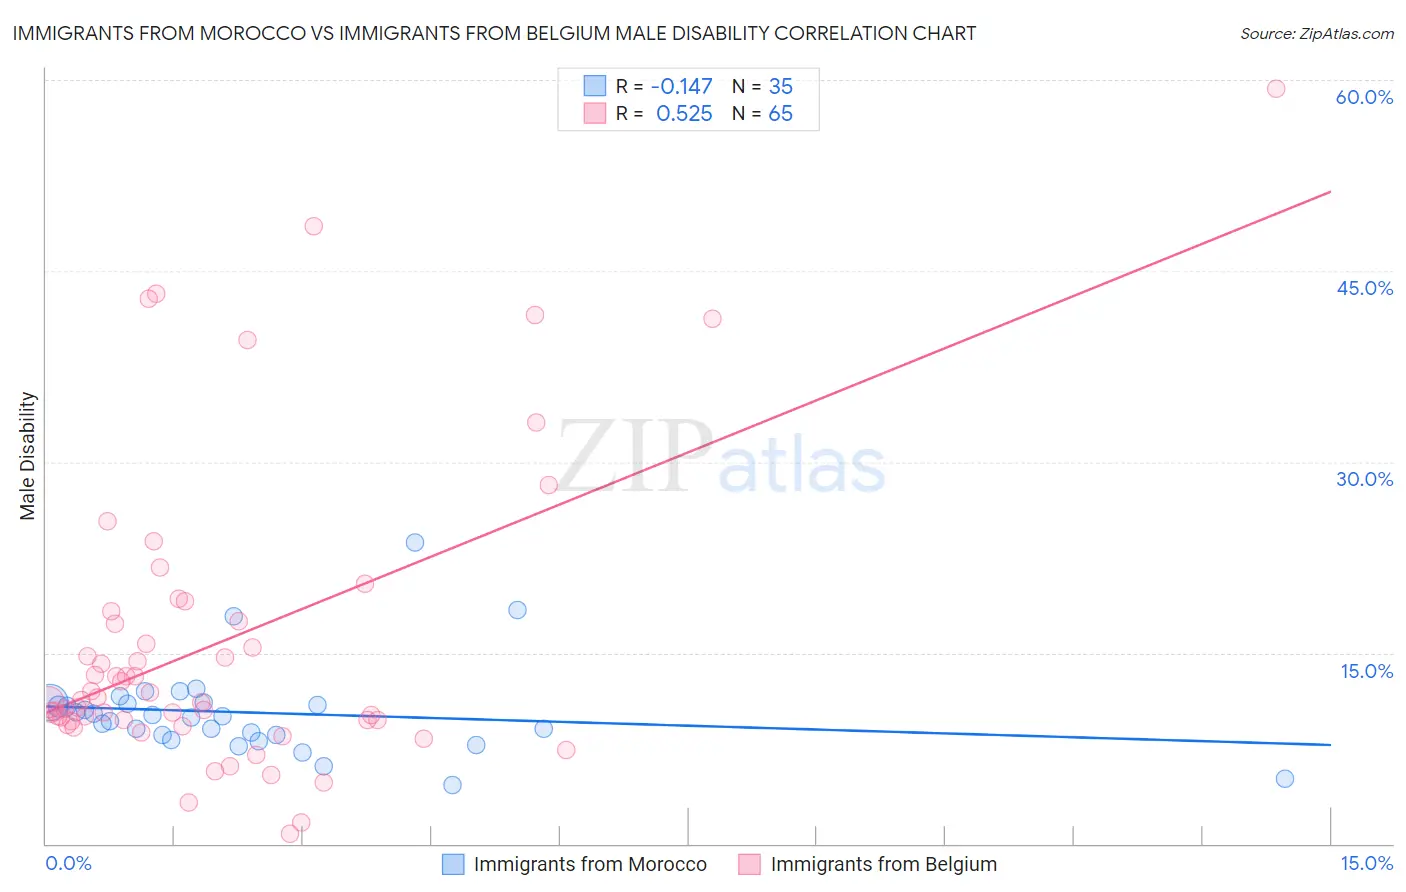
Immigrants from Morocco vs Immigrants from Belgium Male Disability Correlation Chart
The statistical analysis conducted on geographies consisting of 178,909,638 people shows a poor negative correlation between the proportion of Immigrants from Morocco and percentage of males with a disability in the United States with a correlation coefficient (R) of -0.147 and weighted average of 10.6%. Similarly, the statistical analysis conducted on geographies consisting of 146,717,814 people shows a substantial positive correlation between the proportion of Immigrants from Belgium and percentage of males with a disability in the United States with a correlation coefficient (R) of 0.525 and weighted average of 10.8%, a difference of 1.4%.
Male Disability Correlation Summary
| Measurement | Immigrants from Morocco | Immigrants from Belgium |
| Minimum | 4.6% | 0.83% |
| Maximum | 23.6% | 59.3% |
| Range | 19.0% | 58.5% |
| Mean | 10.3% | 15.9% |
| Median | 10.0% | 11.3% |
| Interquartile 25% (IQ1) | 8.5% | 9.7% |
| Interquartile 75% (IQ3) | 11.1% | 17.9% |
| Interquartile Range (IQR) | 2.5% | 8.2% |
| Standard Deviation (Sample) | 3.6% | 11.9% |
| Standard Deviation (Population) | 3.5% | 11.8% |
Demographics Similar to Immigrants from Morocco and Immigrants from Belgium by Male Disability
In terms of male disability, the demographic groups most similar to Immigrants from Morocco are Immigrants from France (10.6%, a difference of 0.040%), Immigrants from Nicaragua (10.6%, a difference of 0.050%), Palestinian (10.7%, a difference of 0.18%), Immigrants from St. Vincent and the Grenadines (10.7%, a difference of 0.31%), and Immigrants from Sweden (10.7%, a difference of 0.42%). Similarly, the demographic groups most similar to Immigrants from Belgium are Immigrants from Eastern Africa (10.8%, a difference of 0.020%), Immigrants from Uganda (10.8%, a difference of 0.050%), Immigrants from Syria (10.8%, a difference of 0.19%), Immigrants from Brazil (10.8%, a difference of 0.24%), and Immigrants from Nigeria (10.8%, a difference of 0.25%).
| Demographics | Rating | Rank | Male Disability |
| Immigrants | Nicaragua | 97.8 /100 | #89 | Exceptional 10.6% |
| Immigrants | Morocco | 97.7 /100 | #90 | Exceptional 10.6% |
| Immigrants | France | 97.6 /100 | #91 | Exceptional 10.6% |
| Palestinians | 97.4 /100 | #92 | Exceptional 10.7% |
| Immigrants | St. Vincent and the Grenadines | 97.1 /100 | #93 | Exceptional 10.7% |
| Immigrants | Sweden | 96.9 /100 | #94 | Exceptional 10.7% |
| Chileans | 96.9 /100 | #95 | Exceptional 10.7% |
| Nicaraguans | 96.6 /100 | #96 | Exceptional 10.7% |
| Immigrants | Armenia | 96.6 /100 | #97 | Exceptional 10.7% |
| Immigrants | Romania | 96.5 /100 | #98 | Exceptional 10.7% |
| Immigrants | Switzerland | 96.1 /100 | #99 | Exceptional 10.7% |
| Immigrants | Kazakhstan | 95.9 /100 | #100 | Exceptional 10.7% |
| Immigrants | Greece | 95.6 /100 | #101 | Exceptional 10.7% |
| Immigrants | Eastern Europe | 95.3 /100 | #102 | Exceptional 10.7% |
| Uruguayans | 95.3 /100 | #103 | Exceptional 10.7% |
| Immigrants | Nigeria | 95.1 /100 | #104 | Exceptional 10.8% |
| Immigrants | Brazil | 95.0 /100 | #105 | Exceptional 10.8% |
| Immigrants | Syria | 94.9 /100 | #106 | Exceptional 10.8% |
| Immigrants | Eastern Africa | 94.3 /100 | #107 | Exceptional 10.8% |
| Immigrants | Belgium | 94.2 /100 | #108 | Exceptional 10.8% |
| Immigrants | Uganda | 94.0 /100 | #109 | Exceptional 10.8% |