Blackfeet vs Immigrants from Cabo Verde Female Disability
COMPARE
Blackfeet
Immigrants from Cabo Verde
Female Disability
Female Disability Comparison
Blackfeet
Immigrants from Cabo Verde
13.8%
FEMALE DISABILITY
0.0/ 100
METRIC RATING
313th/ 347
METRIC RANK
14.6%
FEMALE DISABILITY
0.0/ 100
METRIC RATING
331st/ 347
METRIC RANK
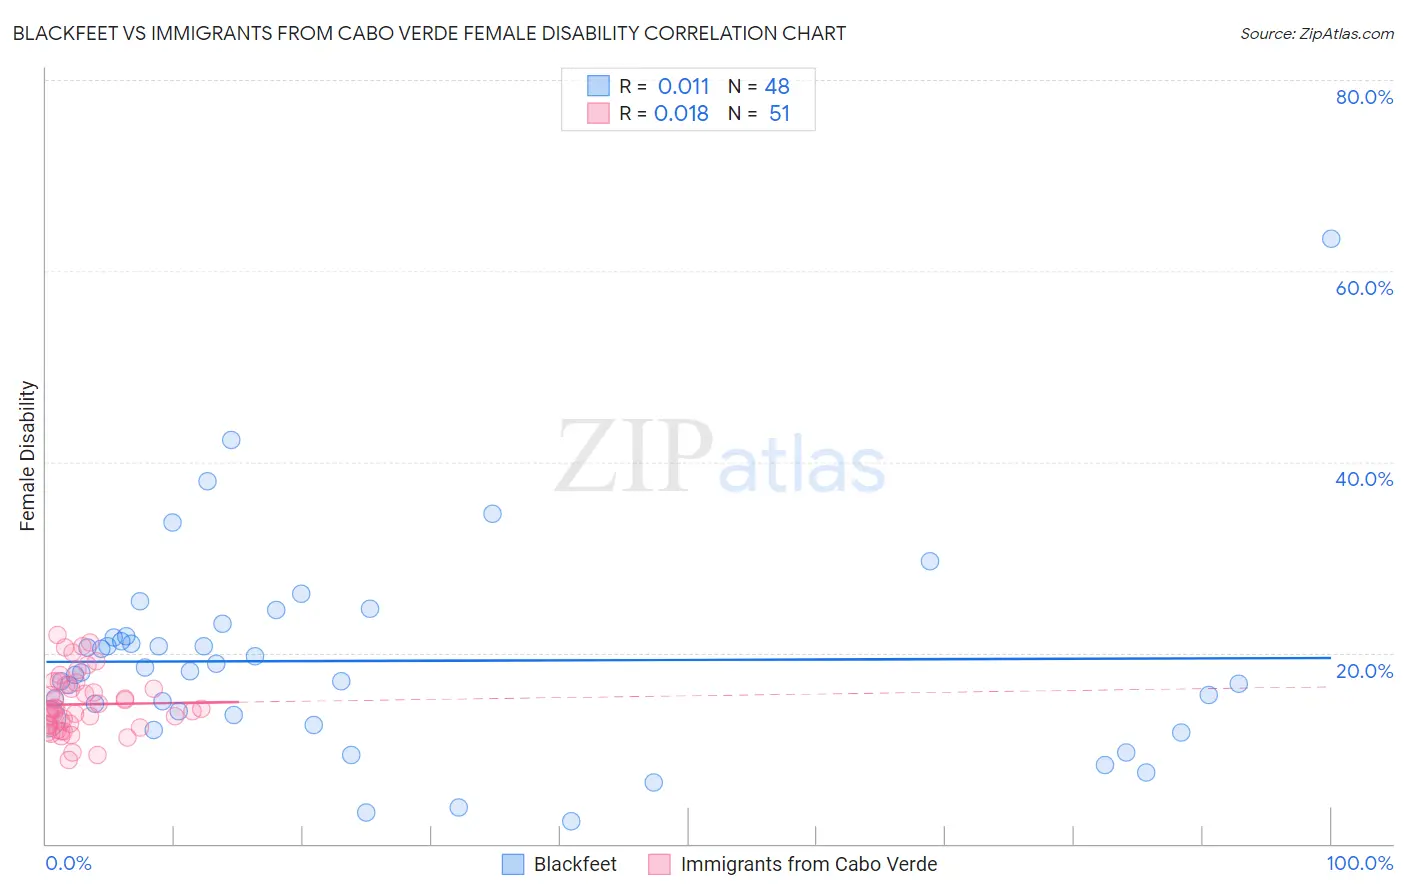
Blackfeet vs Immigrants from Cabo Verde Female Disability Correlation Chart
The statistical analysis conducted on geographies consisting of 309,506,934 people shows no correlation between the proportion of Blackfeet and percentage of females with a disability in the United States with a correlation coefficient (R) of 0.011 and weighted average of 13.8%. Similarly, the statistical analysis conducted on geographies consisting of 38,139,523 people shows no correlation between the proportion of Immigrants from Cabo Verde and percentage of females with a disability in the United States with a correlation coefficient (R) of 0.018 and weighted average of 14.6%, a difference of 5.2%.
Female Disability Correlation Summary
| Measurement | Blackfeet | Immigrants from Cabo Verde |
| Minimum | 2.3% | 8.7% |
| Maximum | 63.4% | 21.8% |
| Range | 61.1% | 13.1% |
| Mean | 19.1% | 14.6% |
| Median | 18.0% | 14.1% |
| Interquartile 25% (IQ1) | 13.3% | 12.4% |
| Interquartile 75% (IQ3) | 21.7% | 16.6% |
| Interquartile Range (IQR) | 8.4% | 4.2% |
| Standard Deviation (Sample) | 10.6% | 3.1% |
| Standard Deviation (Population) | 10.5% | 3.1% |
Demographics Similar to Blackfeet and Immigrants from Cabo Verde by Female Disability
In terms of female disability, the demographic groups most similar to Blackfeet are Puget Sound Salish (13.8%, a difference of 0.10%), Delaware (13.8%, a difference of 0.32%), Alaskan Athabascan (13.9%, a difference of 0.69%), Spanish American (14.0%, a difference of 1.1%), and Chippewa (14.0%, a difference of 1.2%). Similarly, the demographic groups most similar to Immigrants from Cabo Verde are Yuman (14.5%, a difference of 0.42%), Pima (14.8%, a difference of 1.6%), Osage (14.3%, a difference of 1.8%), Ottawa (14.2%, a difference of 2.2%), and Cape Verdean (14.2%, a difference of 2.2%).
| Demographics | Rating | Rank | Female Disability |
| Delaware | 0.0 /100 | #312 | Tragic 13.8% |
| Blackfeet | 0.0 /100 | #313 | Tragic 13.8% |
| Puget Sound Salish | 0.0 /100 | #314 | Tragic 13.8% |
| Alaskan Athabascans | 0.0 /100 | #315 | Tragic 13.9% |
| Spanish Americans | 0.0 /100 | #316 | Tragic 14.0% |
| Chippewa | 0.0 /100 | #317 | Tragic 14.0% |
| Paiute | 0.0 /100 | #318 | Tragic 14.0% |
| Iroquois | 0.0 /100 | #319 | Tragic 14.0% |
| Americans | 0.0 /100 | #320 | Tragic 14.1% |
| Potawatomi | 0.0 /100 | #321 | Tragic 14.1% |
| Pueblo | 0.0 /100 | #322 | Tragic 14.1% |
| Blacks/African Americans | 0.0 /100 | #323 | Tragic 14.1% |
| Natives/Alaskans | 0.0 /100 | #324 | Tragic 14.1% |
| Navajo | 0.0 /100 | #325 | Tragic 14.2% |
| Comanche | 0.0 /100 | #326 | Tragic 14.2% |
| Ottawa | 0.0 /100 | #327 | Tragic 14.2% |
| Cape Verdeans | 0.0 /100 | #328 | Tragic 14.2% |
| Osage | 0.0 /100 | #329 | Tragic 14.3% |
| Yuman | 0.0 /100 | #330 | Tragic 14.5% |
| Immigrants | Cabo Verde | 0.0 /100 | #331 | Tragic 14.6% |
| Pima | 0.0 /100 | #332 | Tragic 14.8% |