Blackfeet vs Immigrants from Cabo Verde Median Household Income
COMPARE
Blackfeet
Immigrants from Cabo Verde
Median Household Income
Median Household Income Comparison
Blackfeet
Immigrants from Cabo Verde
$73,509
MEDIAN HOUSEHOLD INCOME
0.1/ 100
METRIC RATING
294th/ 347
METRIC RANK
$73,515
MEDIAN HOUSEHOLD INCOME
0.1/ 100
METRIC RATING
293rd/ 347
METRIC RANK
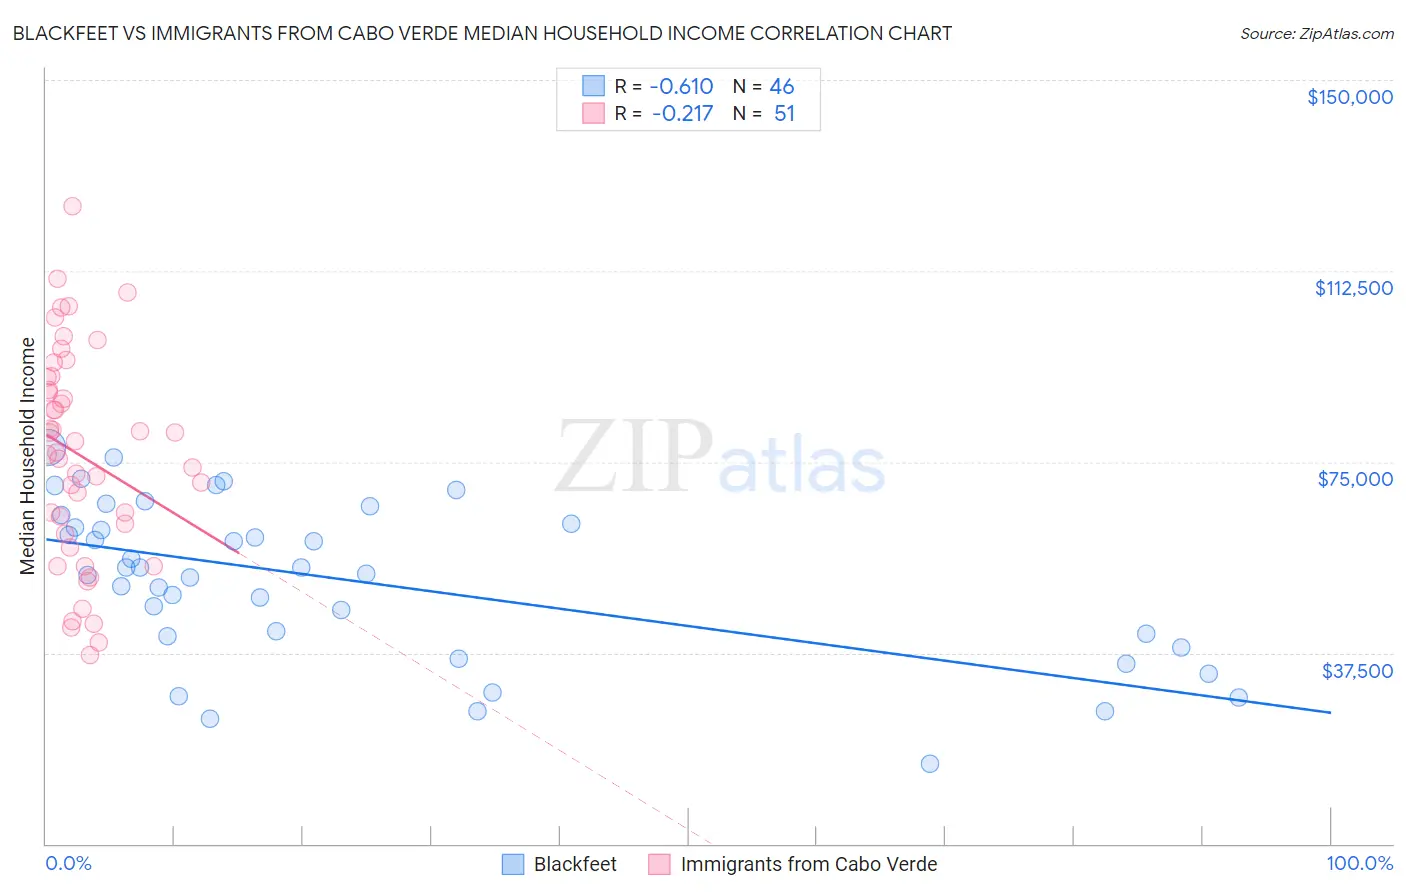
Blackfeet vs Immigrants from Cabo Verde Median Household Income Correlation Chart
The statistical analysis conducted on geographies consisting of 309,432,508 people shows a significant negative correlation between the proportion of Blackfeet and median household income in the United States with a correlation coefficient (R) of -0.610 and weighted average of $73,509. Similarly, the statistical analysis conducted on geographies consisting of 38,130,720 people shows a weak negative correlation between the proportion of Immigrants from Cabo Verde and median household income in the United States with a correlation coefficient (R) of -0.217 and weighted average of $73,515, a difference of 0.010%.
Median Household Income Correlation Summary
| Measurement | Blackfeet | Immigrants from Cabo Verde |
| Minimum | $15,625 | $37,158 |
| Maximum | $77,855 | $125,130 |
| Range | $62,230 | $87,972 |
| Mean | $51,582 | $76,217 |
| Median | $53,641 | $76,886 |
| Interquartile 25% (IQ1) | $40,750 | $60,971 |
| Interquartile 75% (IQ3) | $62,870 | $91,527 |
| Interquartile Range (IQR) | $22,120 | $30,555 |
| Standard Deviation (Sample) | $15,583 | $20,748 |
| Standard Deviation (Population) | $15,413 | $20,544 |
Demographics Similar to Blackfeet and Immigrants from Cabo Verde by Median Household Income
In terms of median household income, the demographic groups most similar to Blackfeet are Cuban ($73,392, a difference of 0.16%), Haitian ($73,306, a difference of 0.28%), Comanche ($73,747, a difference of 0.32%), Hispanic or Latino ($73,823, a difference of 0.43%), and Immigrants from Mexico ($73,160, a difference of 0.48%). Similarly, the demographic groups most similar to Immigrants from Cabo Verde are Cuban ($73,392, a difference of 0.17%), Haitian ($73,306, a difference of 0.29%), Comanche ($73,747, a difference of 0.31%), Hispanic or Latino ($73,823, a difference of 0.42%), and Immigrants from Mexico ($73,160, a difference of 0.49%).
| Demographics | Rating | Rank | Median Household Income |
| Cree | 0.1 /100 | #283 | Tragic $74,685 |
| Yaqui | 0.1 /100 | #284 | Tragic $74,596 |
| Mexicans | 0.1 /100 | #285 | Tragic $74,399 |
| Immigrants | Somalia | 0.1 /100 | #286 | Tragic $74,300 |
| Iroquois | 0.1 /100 | #287 | Tragic $74,279 |
| Immigrants | Central America | 0.1 /100 | #288 | Tragic $74,217 |
| Fijians | 0.1 /100 | #289 | Tragic $74,205 |
| Bangladeshis | 0.1 /100 | #290 | Tragic $74,112 |
| Hispanics or Latinos | 0.1 /100 | #291 | Tragic $73,823 |
| Comanche | 0.1 /100 | #292 | Tragic $73,747 |
| Immigrants | Cabo Verde | 0.1 /100 | #293 | Tragic $73,515 |
| Blackfeet | 0.1 /100 | #294 | Tragic $73,509 |
| Cubans | 0.1 /100 | #295 | Tragic $73,392 |
| Haitians | 0.1 /100 | #296 | Tragic $73,306 |
| Immigrants | Mexico | 0.0 /100 | #297 | Tragic $73,160 |
| Paiute | 0.0 /100 | #298 | Tragic $72,959 |
| Indonesians | 0.0 /100 | #299 | Tragic $72,856 |
| Immigrants | Dominica | 0.0 /100 | #300 | Tragic $72,760 |
| Cherokee | 0.0 /100 | #301 | Tragic $72,682 |
| Shoshone | 0.0 /100 | #302 | Tragic $72,660 |
| Africans | 0.0 /100 | #303 | Tragic $72,650 |