Arapaho vs Immigrants from Spain Male Disability
COMPARE
Arapaho
Immigrants from Spain
Male Disability
Male Disability Comparison
Arapaho
Immigrants from Spain
13.3%
MALE DISABILITY
0.0/ 100
METRIC RATING
307th/ 347
METRIC RANK
10.3%
MALE DISABILITY
99.7/ 100
METRIC RATING
49th/ 347
METRIC RANK
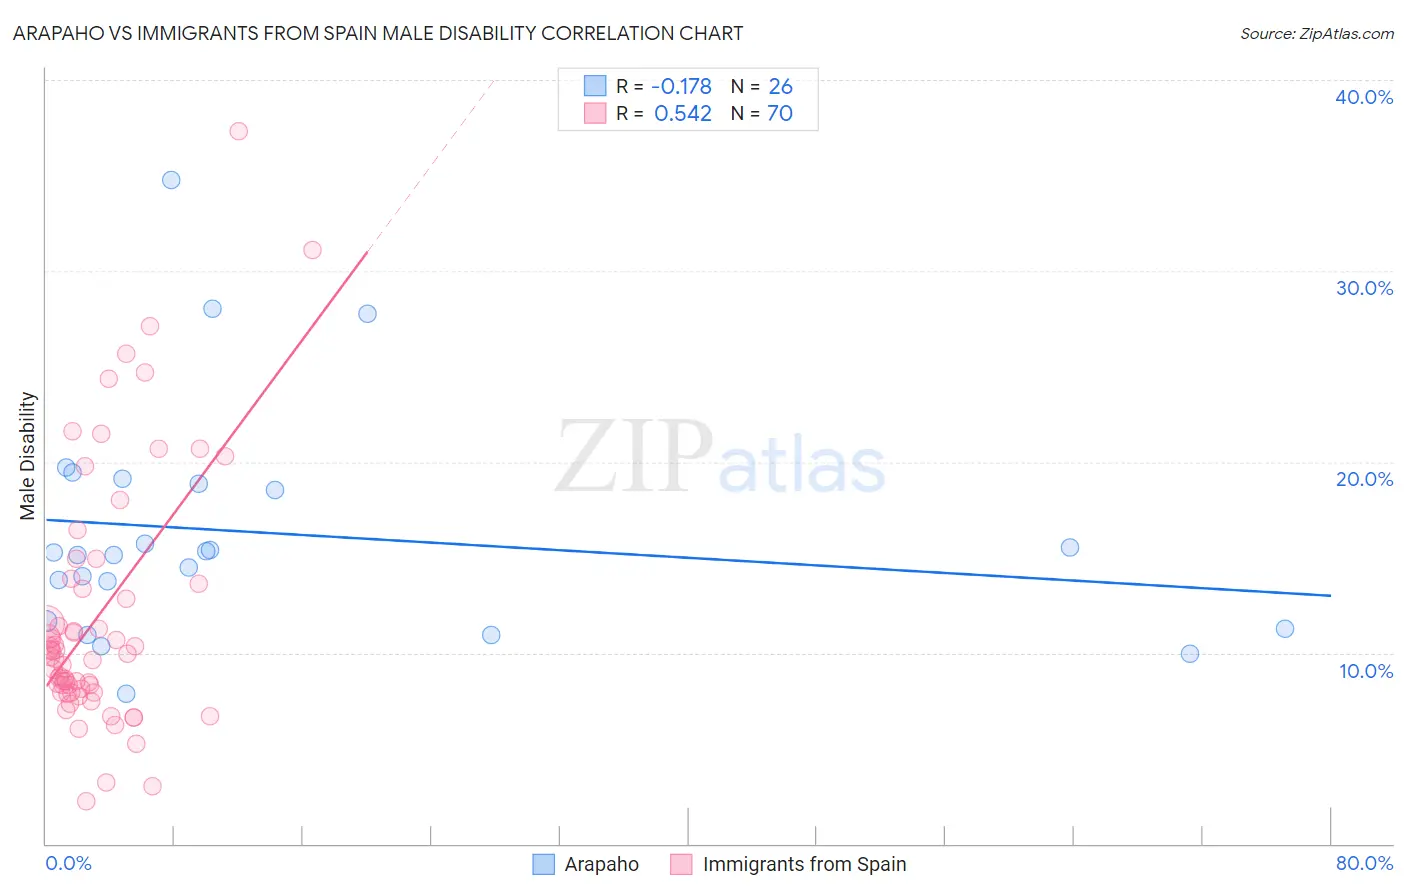
Arapaho vs Immigrants from Spain Male Disability Correlation Chart
The statistical analysis conducted on geographies consisting of 29,780,236 people shows a poor negative correlation between the proportion of Arapaho and percentage of males with a disability in the United States with a correlation coefficient (R) of -0.178 and weighted average of 13.3%. Similarly, the statistical analysis conducted on geographies consisting of 239,682,902 people shows a substantial positive correlation between the proportion of Immigrants from Spain and percentage of males with a disability in the United States with a correlation coefficient (R) of 0.542 and weighted average of 10.3%, a difference of 29.2%.
Male Disability Correlation Summary
| Measurement | Arapaho | Immigrants from Spain |
| Minimum | 7.9% | 2.2% |
| Maximum | 34.7% | 37.3% |
| Range | 26.9% | 35.1% |
| Mean | 16.3% | 11.9% |
| Median | 15.2% | 9.9% |
| Interquartile 25% (IQ1) | 11.6% | 7.9% |
| Interquartile 75% (IQ3) | 18.8% | 13.6% |
| Interquartile Range (IQR) | 7.2% | 5.7% |
| Standard Deviation (Sample) | 6.1% | 6.7% |
| Standard Deviation (Population) | 6.0% | 6.7% |
Similar Demographics by Male Disability
Demographics Similar to Arapaho by Male Disability
In terms of male disability, the demographic groups most similar to Arapaho are French American Indian (13.4%, a difference of 0.15%), Spanish American (13.3%, a difference of 0.22%), French Canadian (13.3%, a difference of 0.42%), Blackfeet (13.4%, a difference of 0.58%), and Immigrants from the Azores (13.4%, a difference of 0.72%).
| Demographics | Rating | Rank | Male Disability |
| Cheyenne | 0.0 /100 | #300 | Tragic 13.0% |
| French | 0.0 /100 | #301 | Tragic 13.0% |
| Crow | 0.0 /100 | #302 | Tragic 13.1% |
| Scotch-Irish | 0.0 /100 | #303 | Tragic 13.2% |
| Blacks/African Americans | 0.0 /100 | #304 | Tragic 13.2% |
| French Canadians | 0.0 /100 | #305 | Tragic 13.3% |
| Spanish Americans | 0.0 /100 | #306 | Tragic 13.3% |
| Arapaho | 0.0 /100 | #307 | Tragic 13.3% |
| French American Indians | 0.0 /100 | #308 | Tragic 13.4% |
| Blackfeet | 0.0 /100 | #309 | Tragic 13.4% |
| Immigrants | Azores | 0.0 /100 | #310 | Tragic 13.4% |
| Delaware | 0.0 /100 | #311 | Tragic 13.5% |
| Yakama | 0.0 /100 | #312 | Tragic 13.5% |
| Puget Sound Salish | 0.0 /100 | #313 | Tragic 13.5% |
| Aleuts | 0.0 /100 | #314 | Tragic 13.5% |
Demographics Similar to Immigrants from Spain by Male Disability
In terms of male disability, the demographic groups most similar to Immigrants from Spain are Israeli (10.3%, a difference of 0.060%), Immigrants from Peru (10.3%, a difference of 0.090%), Cambodian (10.3%, a difference of 0.13%), South American (10.3%, a difference of 0.13%), and Immigrants from El Salvador (10.3%, a difference of 0.21%).
| Demographics | Rating | Rank | Male Disability |
| Mongolians | 99.7 /100 | #42 | Exceptional 10.3% |
| Immigrants | Bangladesh | 99.7 /100 | #43 | Exceptional 10.3% |
| Immigrants | El Salvador | 99.7 /100 | #44 | Exceptional 10.3% |
| Turks | 99.7 /100 | #45 | Exceptional 10.3% |
| Cambodians | 99.7 /100 | #46 | Exceptional 10.3% |
| Immigrants | Peru | 99.7 /100 | #47 | Exceptional 10.3% |
| Israelis | 99.7 /100 | #48 | Exceptional 10.3% |
| Immigrants | Spain | 99.7 /100 | #49 | Exceptional 10.3% |
| South Americans | 99.6 /100 | #50 | Exceptional 10.3% |
| Salvadorans | 99.6 /100 | #51 | Exceptional 10.4% |
| Immigrants | Saudi Arabia | 99.6 /100 | #52 | Exceptional 10.4% |
| Immigrants | Uzbekistan | 99.6 /100 | #53 | Exceptional 10.4% |
| Peruvians | 99.6 /100 | #54 | Exceptional 10.4% |
| Immigrants | Eritrea | 99.6 /100 | #55 | Exceptional 10.4% |
| Tongans | 99.6 /100 | #56 | Exceptional 10.4% |