African vs Immigrants from Yemen Male Disability
COMPARE
African
Immigrants from Yemen
Male Disability
Male Disability Comparison
Africans
Immigrants from Yemen
12.6%
MALE DISABILITY
0.0/ 100
METRIC RATING
276th/ 347
METRIC RANK
12.0%
MALE DISABILITY
0.5/ 100
METRIC RATING
249th/ 347
METRIC RANK
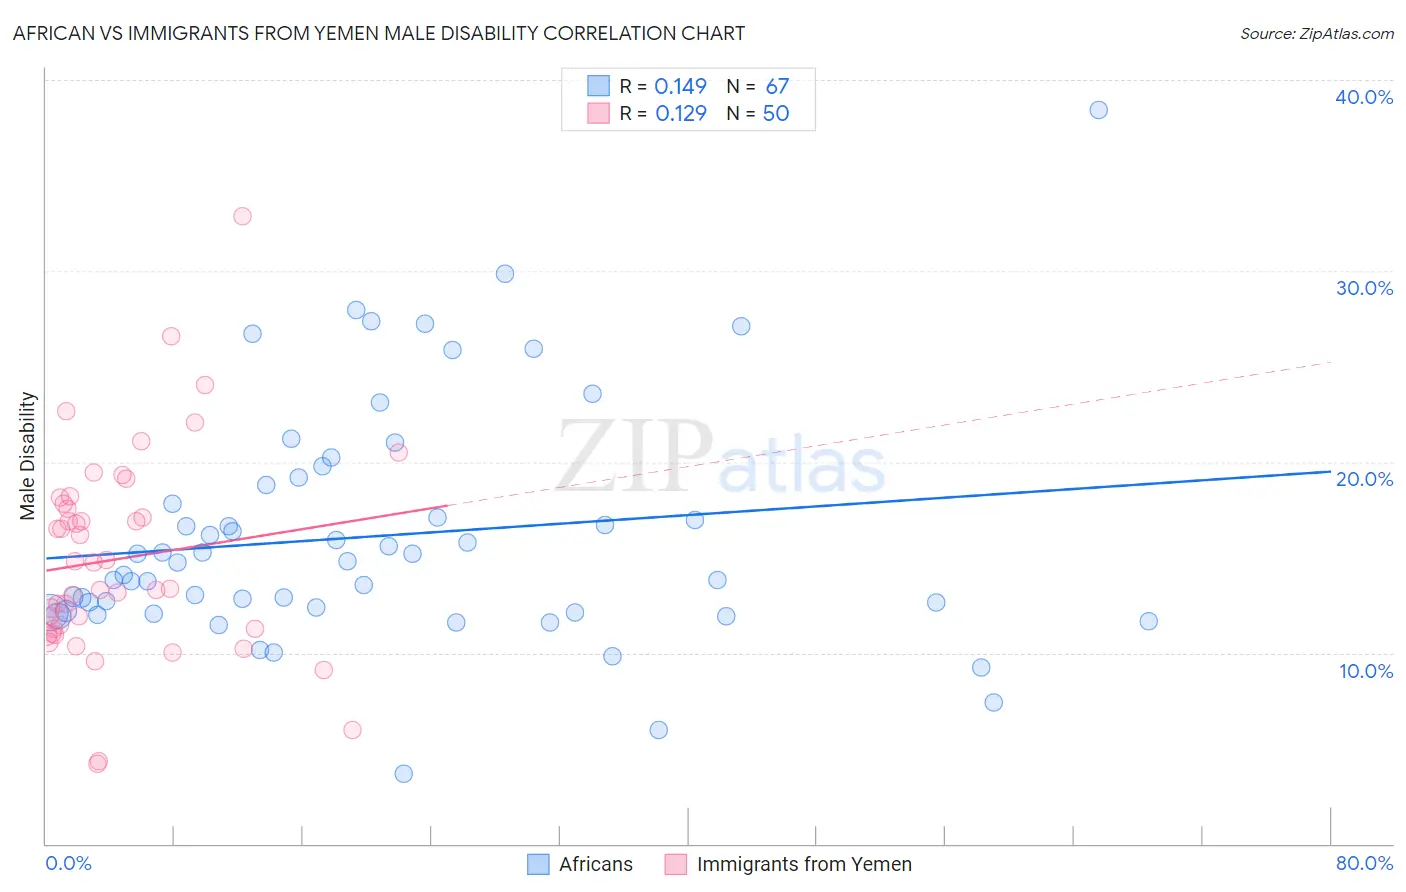
African vs Immigrants from Yemen Male Disability Correlation Chart
The statistical analysis conducted on geographies consisting of 469,942,383 people shows a poor positive correlation between the proportion of Africans and percentage of males with a disability in the United States with a correlation coefficient (R) of 0.149 and weighted average of 12.6%. Similarly, the statistical analysis conducted on geographies consisting of 82,432,015 people shows a poor positive correlation between the proportion of Immigrants from Yemen and percentage of males with a disability in the United States with a correlation coefficient (R) of 0.129 and weighted average of 12.0%, a difference of 4.5%.
Male Disability Correlation Summary
| Measurement | African | Immigrants from Yemen |
| Minimum | 3.6% | 4.2% |
| Maximum | 38.5% | 32.8% |
| Range | 34.8% | 28.6% |
| Mean | 16.1% | 14.9% |
| Median | 14.7% | 14.0% |
| Interquartile 25% (IQ1) | 12.1% | 11.3% |
| Interquartile 75% (IQ3) | 18.8% | 17.8% |
| Interquartile Range (IQR) | 6.7% | 6.6% |
| Standard Deviation (Sample) | 6.2% | 5.4% |
| Standard Deviation (Population) | 6.2% | 5.4% |
Similar Demographics by Male Disability
Demographics Similar to Africans by Male Disability
In terms of male disability, the demographic groups most similar to Africans are Fijian (12.6%, a difference of 0.050%), Finnish (12.6%, a difference of 0.31%), Hopi (12.5%, a difference of 0.40%), Native Hawaiian (12.5%, a difference of 0.74%), and Hmong (12.5%, a difference of 0.80%).
| Demographics | Rating | Rank | Male Disability |
| Czechoslovakians | 0.1 /100 | #269 | Tragic 12.3% |
| Spaniards | 0.1 /100 | #270 | Tragic 12.3% |
| Scandinavians | 0.1 /100 | #271 | Tragic 12.3% |
| Hmong | 0.0 /100 | #272 | Tragic 12.5% |
| Native Hawaiians | 0.0 /100 | #273 | Tragic 12.5% |
| Hopi | 0.0 /100 | #274 | Tragic 12.5% |
| Fijians | 0.0 /100 | #275 | Tragic 12.6% |
| Africans | 0.0 /100 | #276 | Tragic 12.6% |
| Finns | 0.0 /100 | #277 | Tragic 12.6% |
| Central American Indians | 0.0 /100 | #278 | Tragic 12.7% |
| Slovaks | 0.0 /100 | #279 | Tragic 12.7% |
| Dutch | 0.0 /100 | #280 | Tragic 12.7% |
| Sioux | 0.0 /100 | #281 | Tragic 12.7% |
| Irish | 0.0 /100 | #282 | Tragic 12.7% |
| Germans | 0.0 /100 | #283 | Tragic 12.7% |
Demographics Similar to Immigrants from Yemen by Male Disability
In terms of male disability, the demographic groups most similar to Immigrants from Yemen are Bangladeshi (12.0%, a difference of 0.050%), German Russian (12.0%, a difference of 0.060%), Slovene (12.0%, a difference of 0.13%), Guamanian/Chamorro (12.0%, a difference of 0.13%), and British (12.1%, a difference of 0.32%).
| Demographics | Rating | Rank | Male Disability |
| Northern Europeans | 1.1 /100 | #242 | Tragic 11.9% |
| Samoans | 1.1 /100 | #243 | Tragic 11.9% |
| Immigrants | Laos | 1.0 /100 | #244 | Tragic 11.9% |
| Immigrants | Liberia | 1.0 /100 | #245 | Tragic 11.9% |
| Danes | 0.9 /100 | #246 | Tragic 11.9% |
| Hungarians | 0.8 /100 | #247 | Tragic 12.0% |
| Poles | 0.7 /100 | #248 | Tragic 12.0% |
| Immigrants | Yemen | 0.5 /100 | #249 | Tragic 12.0% |
| Bangladeshis | 0.5 /100 | #250 | Tragic 12.0% |
| German Russians | 0.5 /100 | #251 | Tragic 12.0% |
| Slovenes | 0.5 /100 | #252 | Tragic 12.0% |
| Guamanians/Chamorros | 0.5 /100 | #253 | Tragic 12.0% |
| British | 0.4 /100 | #254 | Tragic 12.1% |
| Chinese | 0.4 /100 | #255 | Tragic 12.1% |
| Swiss | 0.3 /100 | #256 | Tragic 12.1% |