African vs South American Male Disability
COMPARE
African
South American
Male Disability
Male Disability Comparison
Africans
South Americans
12.6%
MALE DISABILITY
0.0/ 100
METRIC RATING
276th/ 347
METRIC RANK
10.3%
MALE DISABILITY
99.6/ 100
METRIC RATING
50th/ 347
METRIC RANK
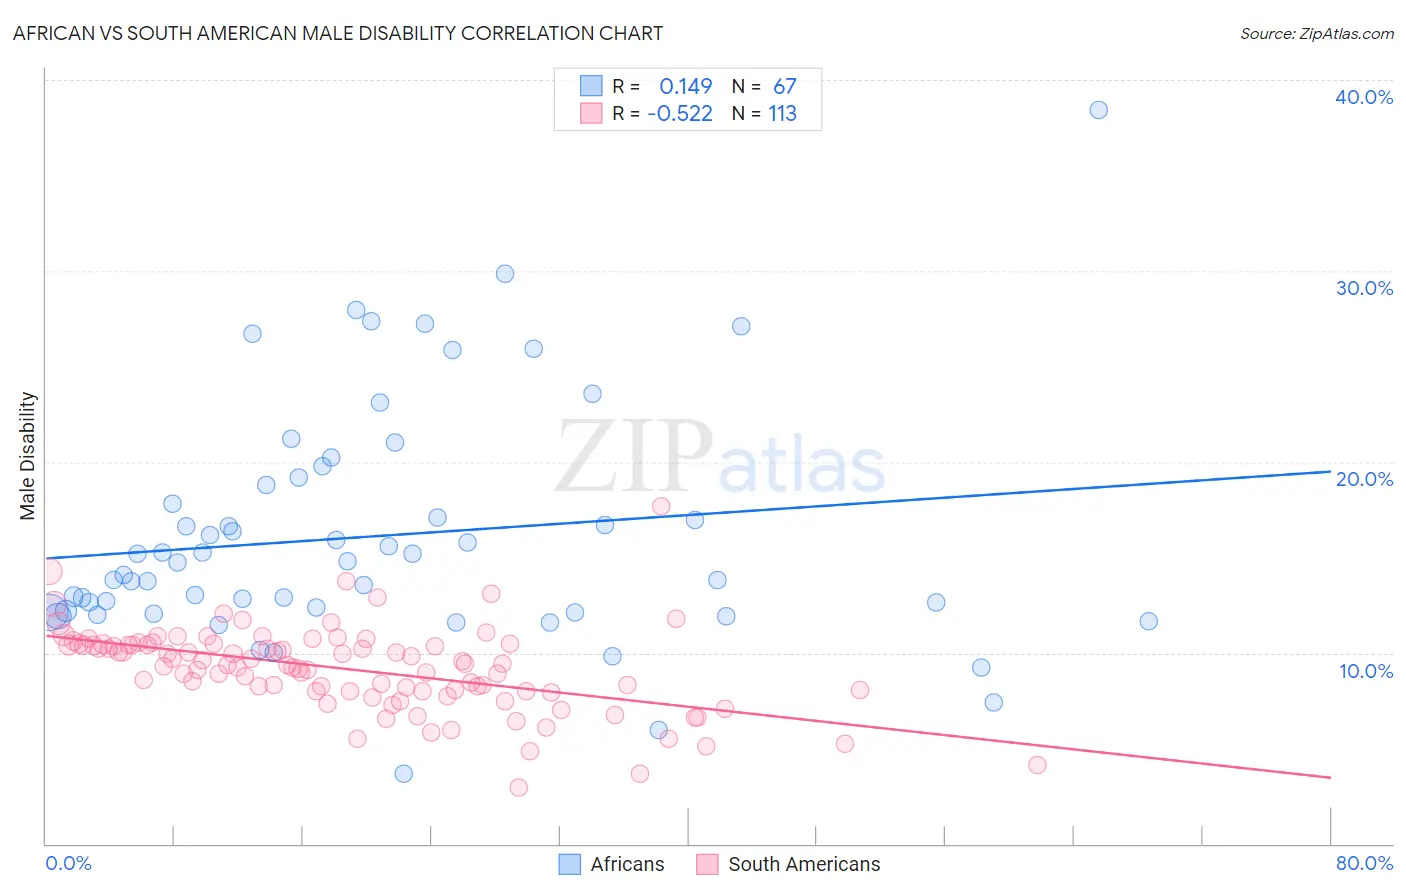
African vs South American Male Disability Correlation Chart
The statistical analysis conducted on geographies consisting of 469,942,383 people shows a poor positive correlation between the proportion of Africans and percentage of males with a disability in the United States with a correlation coefficient (R) of 0.149 and weighted average of 12.6%. Similarly, the statistical analysis conducted on geographies consisting of 494,014,991 people shows a substantial negative correlation between the proportion of South Americans and percentage of males with a disability in the United States with a correlation coefficient (R) of -0.522 and weighted average of 10.3%, a difference of 21.6%.
Male Disability Correlation Summary
| Measurement | African | South American |
| Minimum | 3.6% | 2.9% |
| Maximum | 38.5% | 17.7% |
| Range | 34.8% | 14.8% |
| Mean | 16.1% | 9.2% |
| Median | 14.7% | 9.4% |
| Interquartile 25% (IQ1) | 12.1% | 8.0% |
| Interquartile 75% (IQ3) | 18.8% | 10.4% |
| Interquartile Range (IQR) | 6.7% | 2.5% |
| Standard Deviation (Sample) | 6.2% | 2.2% |
| Standard Deviation (Population) | 6.2% | 2.2% |
Similar Demographics by Male Disability
Demographics Similar to Africans by Male Disability
In terms of male disability, the demographic groups most similar to Africans are Fijian (12.6%, a difference of 0.050%), Finnish (12.6%, a difference of 0.31%), Hopi (12.5%, a difference of 0.40%), Native Hawaiian (12.5%, a difference of 0.74%), and Hmong (12.5%, a difference of 0.80%).
| Demographics | Rating | Rank | Male Disability |
| Czechoslovakians | 0.1 /100 | #269 | Tragic 12.3% |
| Spaniards | 0.1 /100 | #270 | Tragic 12.3% |
| Scandinavians | 0.1 /100 | #271 | Tragic 12.3% |
| Hmong | 0.0 /100 | #272 | Tragic 12.5% |
| Native Hawaiians | 0.0 /100 | #273 | Tragic 12.5% |
| Hopi | 0.0 /100 | #274 | Tragic 12.5% |
| Fijians | 0.0 /100 | #275 | Tragic 12.6% |
| Africans | 0.0 /100 | #276 | Tragic 12.6% |
| Finns | 0.0 /100 | #277 | Tragic 12.6% |
| Central American Indians | 0.0 /100 | #278 | Tragic 12.7% |
| Slovaks | 0.0 /100 | #279 | Tragic 12.7% |
| Dutch | 0.0 /100 | #280 | Tragic 12.7% |
| Sioux | 0.0 /100 | #281 | Tragic 12.7% |
| Irish | 0.0 /100 | #282 | Tragic 12.7% |
| Germans | 0.0 /100 | #283 | Tragic 12.7% |
Demographics Similar to South Americans by Male Disability
In terms of male disability, the demographic groups most similar to South Americans are Immigrants from Spain (10.3%, a difference of 0.13%), Israeli (10.3%, a difference of 0.19%), Salvadoran (10.4%, a difference of 0.19%), Immigrants from Saudi Arabia (10.4%, a difference of 0.21%), and Immigrants from Peru (10.3%, a difference of 0.23%).
| Demographics | Rating | Rank | Male Disability |
| Immigrants | Bangladesh | 99.7 /100 | #43 | Exceptional 10.3% |
| Immigrants | El Salvador | 99.7 /100 | #44 | Exceptional 10.3% |
| Turks | 99.7 /100 | #45 | Exceptional 10.3% |
| Cambodians | 99.7 /100 | #46 | Exceptional 10.3% |
| Immigrants | Peru | 99.7 /100 | #47 | Exceptional 10.3% |
| Israelis | 99.7 /100 | #48 | Exceptional 10.3% |
| Immigrants | Spain | 99.7 /100 | #49 | Exceptional 10.3% |
| South Americans | 99.6 /100 | #50 | Exceptional 10.3% |
| Salvadorans | 99.6 /100 | #51 | Exceptional 10.4% |
| Immigrants | Saudi Arabia | 99.6 /100 | #52 | Exceptional 10.4% |
| Immigrants | Uzbekistan | 99.6 /100 | #53 | Exceptional 10.4% |
| Peruvians | 99.6 /100 | #54 | Exceptional 10.4% |
| Immigrants | Eritrea | 99.6 /100 | #55 | Exceptional 10.4% |
| Tongans | 99.6 /100 | #56 | Exceptional 10.4% |
| Immigrants | South America | 99.6 /100 | #57 | Exceptional 10.4% |