African vs Immigrants from Yemen Child Poverty Among Girls Under 16
COMPARE
African
Immigrants from Yemen
Child Poverty Among Girls Under 16
Child Poverty Among Girls Under 16 Comparison
Africans
Immigrants from Yemen
21.9%
CHILD POVERTY AMONG GIRLS UNDER 16
0.0/ 100
METRIC RATING
317th/ 347
METRIC RANK
29.5%
CHILD POVERTY AMONG GIRLS UNDER 16
0.0/ 100
METRIC RATING
343rd/ 347
METRIC RANK
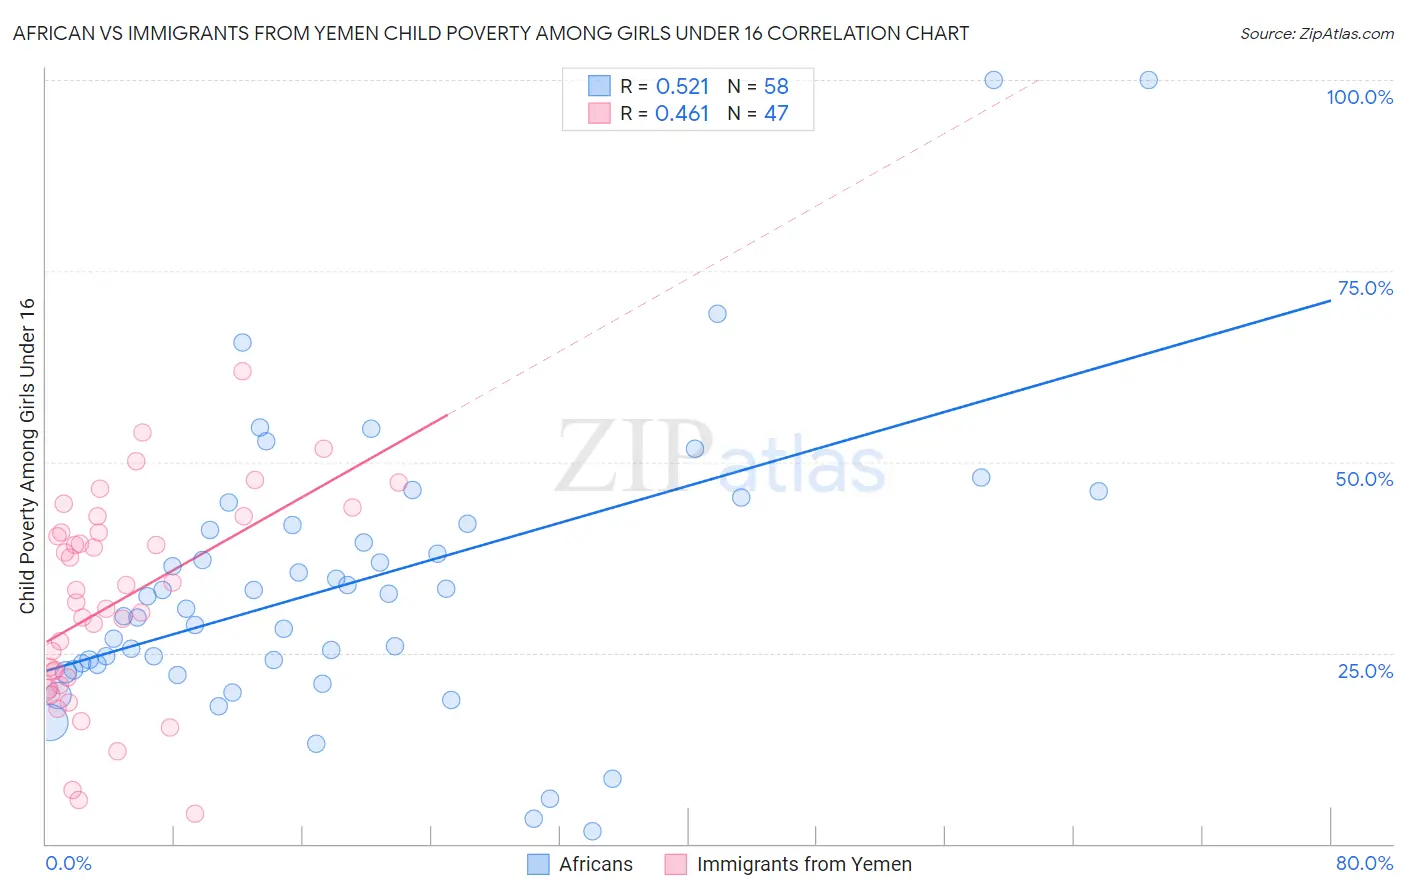
African vs Immigrants from Yemen Child Poverty Among Girls Under 16 Correlation Chart
The statistical analysis conducted on geographies consisting of 462,760,233 people shows a substantial positive correlation between the proportion of Africans and poverty level among girls under the age of 16 in the United States with a correlation coefficient (R) of 0.521 and weighted average of 21.9%. Similarly, the statistical analysis conducted on geographies consisting of 82,295,709 people shows a moderate positive correlation between the proportion of Immigrants from Yemen and poverty level among girls under the age of 16 in the United States with a correlation coefficient (R) of 0.461 and weighted average of 29.5%, a difference of 34.5%.
Child Poverty Among Girls Under 16 Correlation Summary
| Measurement | African | Immigrants from Yemen |
| Minimum | 1.7% | 3.9% |
| Maximum | 100.0% | 61.8% |
| Range | 98.3% | 57.9% |
| Mean | 33.9% | 31.7% |
| Median | 31.6% | 31.7% |
| Interquartile 25% (IQ1) | 23.5% | 20.8% |
| Interquartile 75% (IQ3) | 41.7% | 40.8% |
| Interquartile Range (IQR) | 18.2% | 20.0% |
| Standard Deviation (Sample) | 18.8% | 13.4% |
| Standard Deviation (Population) | 18.6% | 13.2% |
Similar Demographics by Child Poverty Among Girls Under 16
Demographics Similar to Africans by Child Poverty Among Girls Under 16
In terms of child poverty among girls under 16, the demographic groups most similar to Africans are Immigrants from Guatemala (21.9%, a difference of 0.32%), Ute (21.8%, a difference of 0.59%), Immigrants from Dominica (22.1%, a difference of 0.66%), U.S. Virgin Islander (22.1%, a difference of 0.82%), and Arapaho (21.7%, a difference of 0.87%).
| Demographics | Rating | Rank | Child Poverty Among Girls Under 16 |
| Immigrants | Somalia | 0.0 /100 | #310 | Tragic 21.6% |
| Dutch West Indians | 0.0 /100 | #311 | Tragic 21.6% |
| Immigrants | Mexico | 0.0 /100 | #312 | Tragic 21.6% |
| Creek | 0.0 /100 | #313 | Tragic 21.7% |
| Arapaho | 0.0 /100 | #314 | Tragic 21.7% |
| Ute | 0.0 /100 | #315 | Tragic 21.8% |
| Immigrants | Guatemala | 0.0 /100 | #316 | Tragic 21.9% |
| Africans | 0.0 /100 | #317 | Tragic 21.9% |
| Immigrants | Dominica | 0.0 /100 | #318 | Tragic 22.1% |
| U.S. Virgin Islanders | 0.0 /100 | #319 | Tragic 22.1% |
| Hondurans | 0.0 /100 | #320 | Tragic 22.2% |
| Colville | 0.0 /100 | #321 | Tragic 22.5% |
| Yakama | 0.0 /100 | #322 | Tragic 22.6% |
| Cajuns | 0.0 /100 | #323 | Tragic 22.6% |
| Paiute | 0.0 /100 | #324 | Tragic 22.6% |
Demographics Similar to Immigrants from Yemen by Child Poverty Among Girls Under 16
In terms of child poverty among girls under 16, the demographic groups most similar to Immigrants from Yemen are Navajo (30.5%, a difference of 3.3%), Lumbee (30.7%, a difference of 4.1%), Pima (28.2%, a difference of 4.5%), Hopi (27.9%, a difference of 5.9%), and Tohono O'odham (31.6%, a difference of 7.2%).
| Demographics | Rating | Rank | Child Poverty Among Girls Under 16 |
| Blacks/African Americans | 0.0 /100 | #333 | Tragic 24.7% |
| Menominee | 0.0 /100 | #334 | Tragic 25.0% |
| Pueblo | 0.0 /100 | #335 | Tragic 25.2% |
| Sioux | 0.0 /100 | #336 | Tragic 25.6% |
| Yup'ik | 0.0 /100 | #337 | Tragic 25.8% |
| Cheyenne | 0.0 /100 | #338 | Tragic 26.3% |
| Crow | 0.0 /100 | #339 | Tragic 26.4% |
| Yuman | 0.0 /100 | #340 | Tragic 27.1% |
| Hopi | 0.0 /100 | #341 | Tragic 27.9% |
| Pima | 0.0 /100 | #342 | Tragic 28.2% |
| Immigrants | Yemen | 0.0 /100 | #343 | Tragic 29.5% |
| Navajo | 0.0 /100 | #344 | Tragic 30.5% |
| Lumbee | 0.0 /100 | #345 | Tragic 30.7% |
| Tohono O'odham | 0.0 /100 | #346 | Tragic 31.6% |
| Puerto Ricans | 0.0 /100 | #347 | Tragic 32.7% |