Zip Codes with the Highest Percentage of Households with Income Above $100,000 in Norwalk, CT
RELATED REPORTS & OPTIONS
Household Income | $100k+
Norwalk
Compare Zip Codes
Map of Zip Codes with the Highest Percentage of Households with Income Above $100,000 in Norwalk
40.4%
70.3%
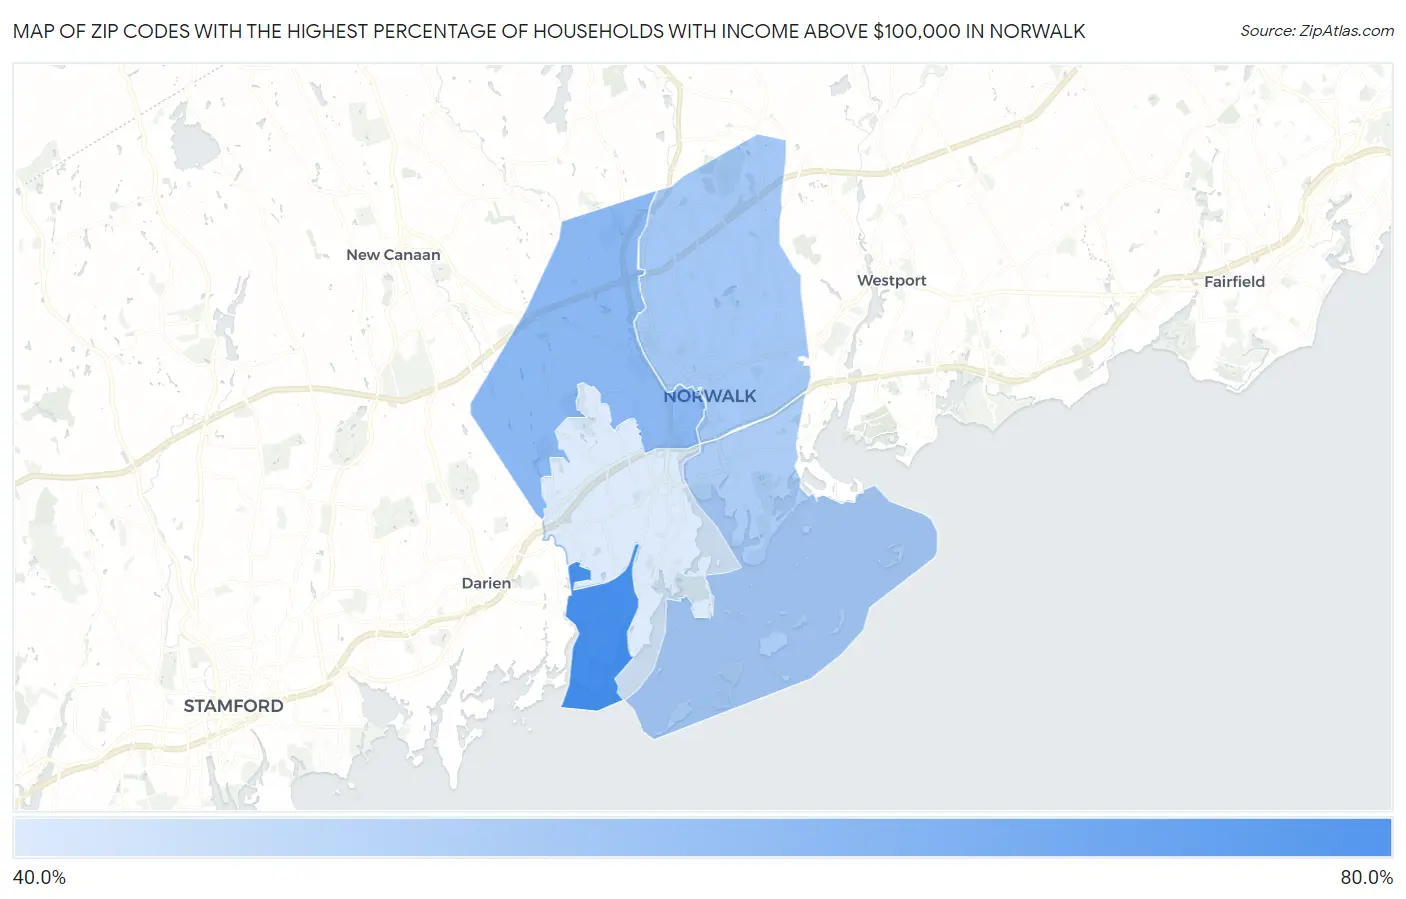
Zip Codes with the Highest Percentage of Households with Income Above $100,000 in Norwalk, CT
| Zip Code | Households with Income > $100k | vs State | vs National | |
| 1. | 06853 | 70.3% | 45.6%(+24.7)#28 | 37.3%(+33.0)#939 |
| 2. | 06850 | 56.2% | 45.6%(+10.6)#91 | 37.3%(+18.9)#3,155 |
| 3. | 06851 | 51.1% | 45.6%(+5.50)#136 | 37.3%(+13.8)#4,505 |
| 4. | 06855 | 49.4% | 45.6%(+3.80)#151 | 37.3%(+12.1)#5,062 |
| 5. | 06854 | 40.4% | 45.6%(-5.20)#206 | 37.3%(+3.10)#8,696 |
1
Common Questions
What are the Top 3 Zip Codes with the Highest Percentage of Households with Income Above $100,000 in Norwalk, CT?
Top 3 Zip Codes with the Highest Percentage of Households with Income Above $100,000 in Norwalk, CT are:
What zip code has the Highest Percentage of Households with Income Above $100,000 in Norwalk, CT?
06853 has the Highest Percentage of Households with Income Above $100,000 in Norwalk, CT with 70.3%.
What is the Percentage of Households with Income Above $100,000 in Norwalk, CT?
Percentage of Households with Income Above $100,000 in Norwalk is 49.1%.
What is the Percentage of Households with Income Above $100,000 in Connecticut?
Percentage of Households with Income Above $100,000 in Connecticut is 45.6%.
What is the Percentage of Households with Income Above $100,000 in the United States?
Percentage of Households with Income Above $100,000 in the United States is 37.3%.