Zip Codes with the Highest Percentage of Population with a Degree in Liberal Arts and History in Norwalk, CT
RELATED REPORTS & OPTIONS
Liberal Arts and History
Norwalk
Compare Zip Codes
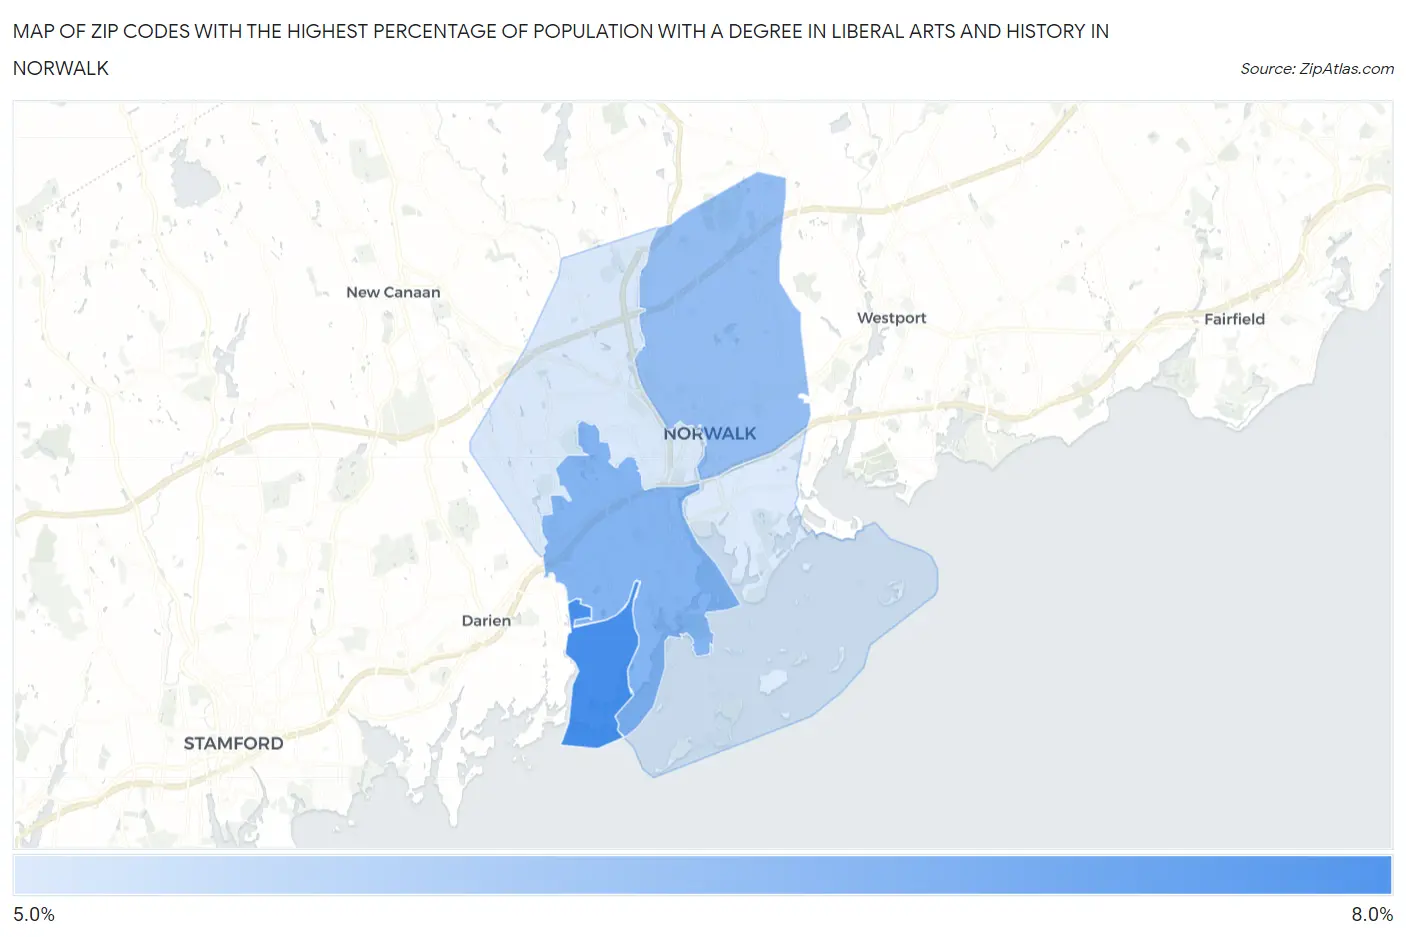
Map of Zip Codes with the Highest Percentage of Population with a Degree in Liberal Arts and History in Norwalk
5.0%
7.3%
Zip Codes with the Highest Percentage of Population with a Degree in Liberal Arts and History in Norwalk, CT
| Zip Code | % Graduates | vs State | vs National | |
| 1. | 06853 | 7.3% | 5.5%(+1.77)#52 | 4.9%(+2.39)#5,945 |
| 2. | 06854 | 6.4% | 5.5%(+0.881)#86 | 4.9%(+1.50)#7,628 |
| 3. | 06851 | 6.1% | 5.5%(+0.646)#95 | 4.9%(+1.26)#8,171 |
| 4. | 06850 | 5.1% | 5.5%(-0.372)#143 | 4.9%(+0.243)#10,988 |
| 5. | 06855 | 5.0% | 5.5%(-0.457)#148 | 4.9%(+0.159)#11,260 |
1
Common Questions
What are the Top 3 Zip Codes with the Highest Percentage of Population with a Degree in Liberal Arts and History in Norwalk, CT?
Top 3 Zip Codes with the Highest Percentage of Population with a Degree in Liberal Arts and History in Norwalk, CT are:
What zip code has the Highest Percentage of Population with a Degree in Liberal Arts and History in Norwalk, CT?
06853 has the Highest Percentage of Population with a Degree in Liberal Arts and History in Norwalk, CT with 7.3%.
What is the Percentage of Population with a Degree in Liberal Arts and History in Norwalk, CT?
Percentage of Population with a Degree in Liberal Arts and History in Norwalk is 5.9%.
What is the Percentage of Population with a Degree in Liberal Arts and History in Connecticut?
Percentage of Population with a Degree in Liberal Arts and History in Connecticut is 5.5%.
What is the Percentage of Population with a Degree in Liberal Arts and History in the United States?
Percentage of Population with a Degree in Liberal Arts and History in the United States is 4.9%.