Zip Codes with the Highest Percentage of Population with a Degree in Visual and Performing Arts in Norwalk, CT
RELATED REPORTS & OPTIONS
Visual and Performing Arts
Norwalk
Compare Zip Codes
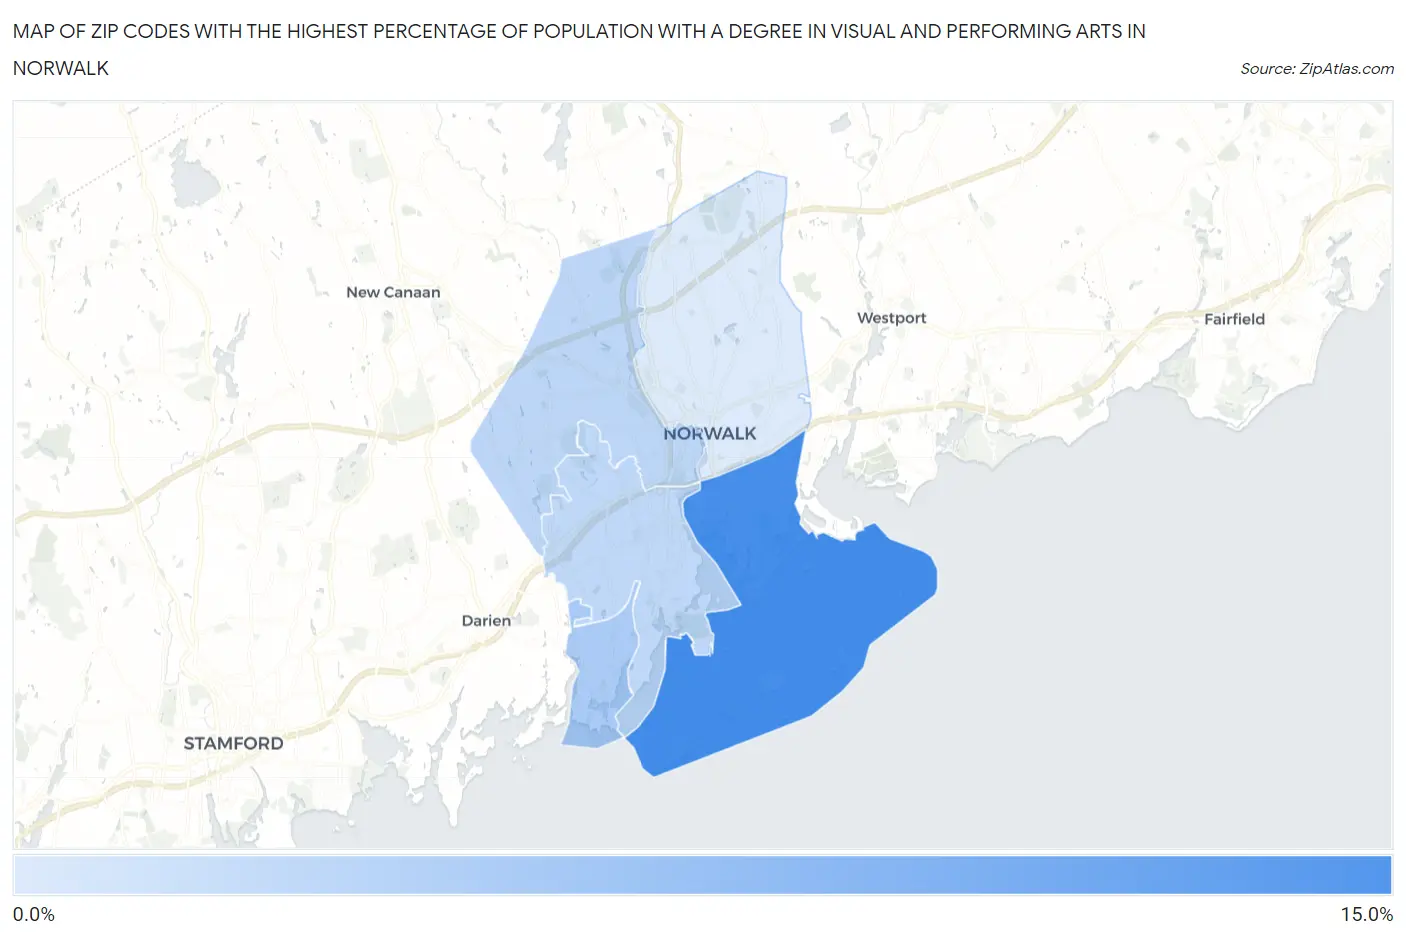
Map of Zip Codes with the Highest Percentage of Population with a Degree in Visual and Performing Arts in Norwalk
4.4%
12.2%
Zip Codes with the Highest Percentage of Population with a Degree in Visual and Performing Arts in Norwalk, CT
| Zip Code | % Graduates | vs State | vs National | |
| 1. | 06855 | 12.2% | 4.7%(+7.52)#16 | 4.3%(+7.98)#1,244 |
| 2. | 06853 | 7.1% | 4.7%(+2.35)#50 | 4.3%(+2.81)#3,599 |
| 3. | 06850 | 6.0% | 4.7%(+1.32)#73 | 4.3%(+1.79)#4,823 |
| 4. | 06854 | 6.0% | 4.7%(+1.24)#78 | 4.3%(+1.71)#4,928 |
| 5. | 06851 | 4.4% | 4.7%(-0.272)#137 | 4.3%(+0.194)#7,953 |
1
Common Questions
What are the Top 3 Zip Codes with the Highest Percentage of Population with a Degree in Visual and Performing Arts in Norwalk, CT?
Top 3 Zip Codes with the Highest Percentage of Population with a Degree in Visual and Performing Arts in Norwalk, CT are:
What zip code has the Highest Percentage of Population with a Degree in Visual and Performing Arts in Norwalk, CT?
06855 has the Highest Percentage of Population with a Degree in Visual and Performing Arts in Norwalk, CT with 12.2%.
What is the Percentage of Population with a Degree in Visual and Performing Arts in Norwalk, CT?
Percentage of Population with a Degree in Visual and Performing Arts in Norwalk is 6.1%.
What is the Percentage of Population with a Degree in Visual and Performing Arts in Connecticut?
Percentage of Population with a Degree in Visual and Performing Arts in Connecticut is 4.7%.
What is the Percentage of Population with a Degree in Visual and Performing Arts in the United States?
Percentage of Population with a Degree in Visual and Performing Arts in the United States is 4.3%.