Zip Codes with the Highest Percentage of Population with a Degree in Visual and Performing Arts in Bridgeport, CT
RELATED REPORTS & OPTIONS
Visual and Performing Arts
Bridgeport
Compare Zip Codes
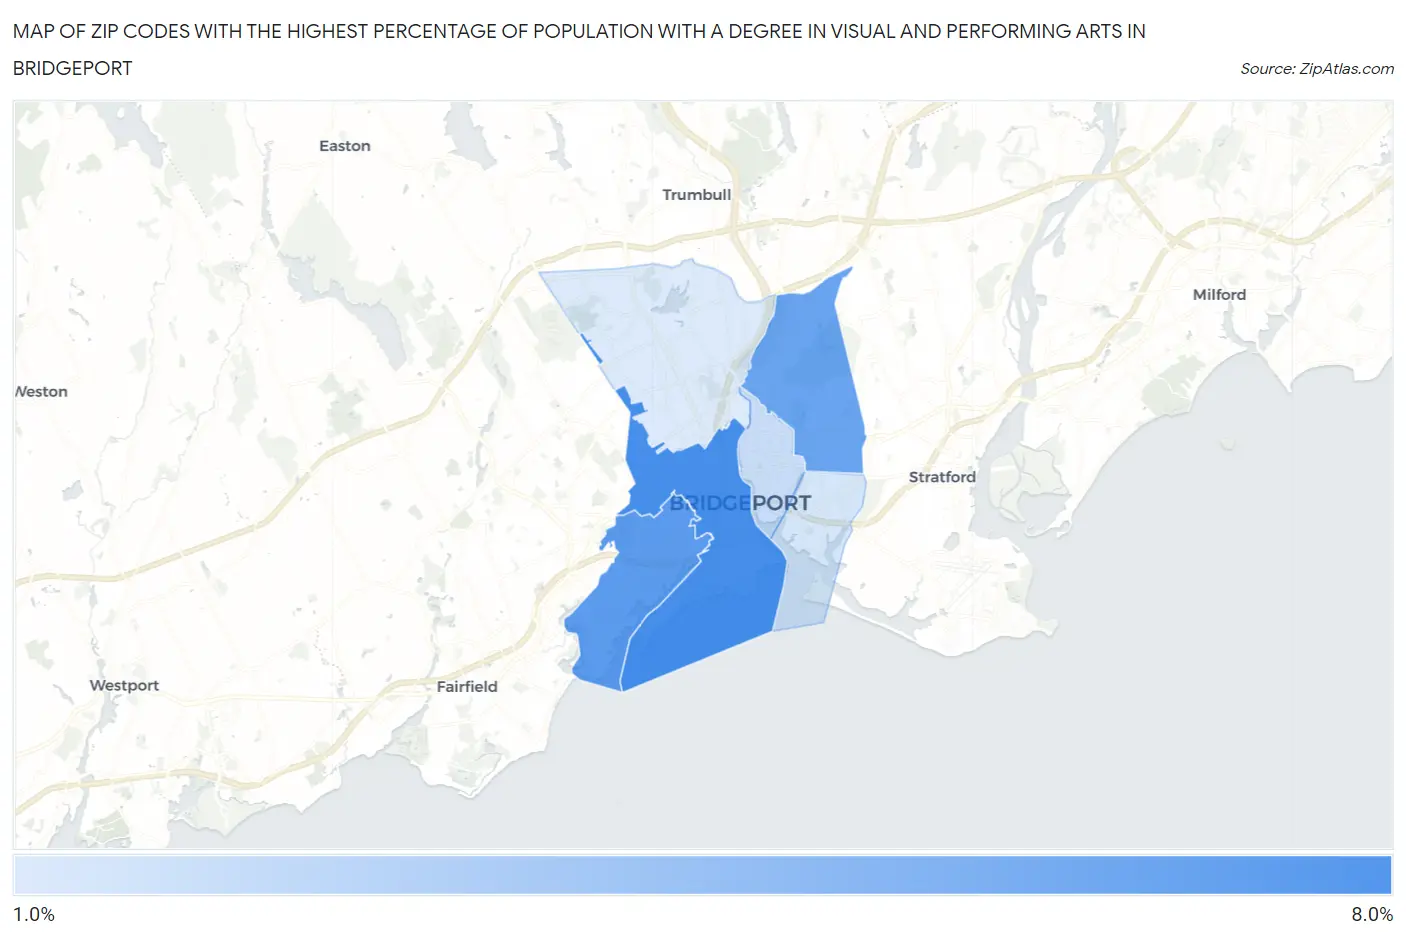
Map of Zip Codes with the Highest Percentage of Population with a Degree in Visual and Performing Arts in Bridgeport
1.7%
7.7%
Zip Codes with the Highest Percentage of Population with a Degree in Visual and Performing Arts in Bridgeport, CT
| Zip Code | % Graduates | vs State | vs National | |
| 1. | 06604 | 7.7% | 4.7%(+2.98)#38 | 4.3%(+3.45)#3,051 |
| 2. | 06605 | 6.9% | 4.7%(+2.21)#53 | 4.3%(+2.68)#3,729 |
| 3. | 06610 | 6.3% | 4.7%(+1.57)#68 | 4.3%(+2.04)#4,474 |
| 4. | 06608 | 2.4% | 4.7%(-2.28)#214 | 4.3%(-1.82)#14,859 |
| 5. | 06607 | 2.0% | 4.7%(-2.76)#229 | 4.3%(-2.29)#16,582 |
| 6. | 06606 | 1.7% | 4.7%(-3.07)#238 | 4.3%(-2.60)#17,669 |
1
Common Questions
What are the Top 5 Zip Codes with the Highest Percentage of Population with a Degree in Visual and Performing Arts in Bridgeport, CT?
Top 5 Zip Codes with the Highest Percentage of Population with a Degree in Visual and Performing Arts in Bridgeport, CT are:
What zip code has the Highest Percentage of Population with a Degree in Visual and Performing Arts in Bridgeport, CT?
06604 has the Highest Percentage of Population with a Degree in Visual and Performing Arts in Bridgeport, CT with 7.7%.
What is the Percentage of Population with a Degree in Visual and Performing Arts in Bridgeport, CT?
Percentage of Population with a Degree in Visual and Performing Arts in Bridgeport is 4.9%.
What is the Percentage of Population with a Degree in Visual and Performing Arts in Connecticut?
Percentage of Population with a Degree in Visual and Performing Arts in Connecticut is 4.7%.
What is the Percentage of Population with a Degree in Visual and Performing Arts in the United States?
Percentage of Population with a Degree in Visual and Performing Arts in the United States is 4.3%.