Zip Codes with the Highest Percentage of Population Employed in Legal Services & Support in Bridgeport, CT
RELATED REPORTS & OPTIONS
Legal Services & Support
Bridgeport
Compare Zip Codes
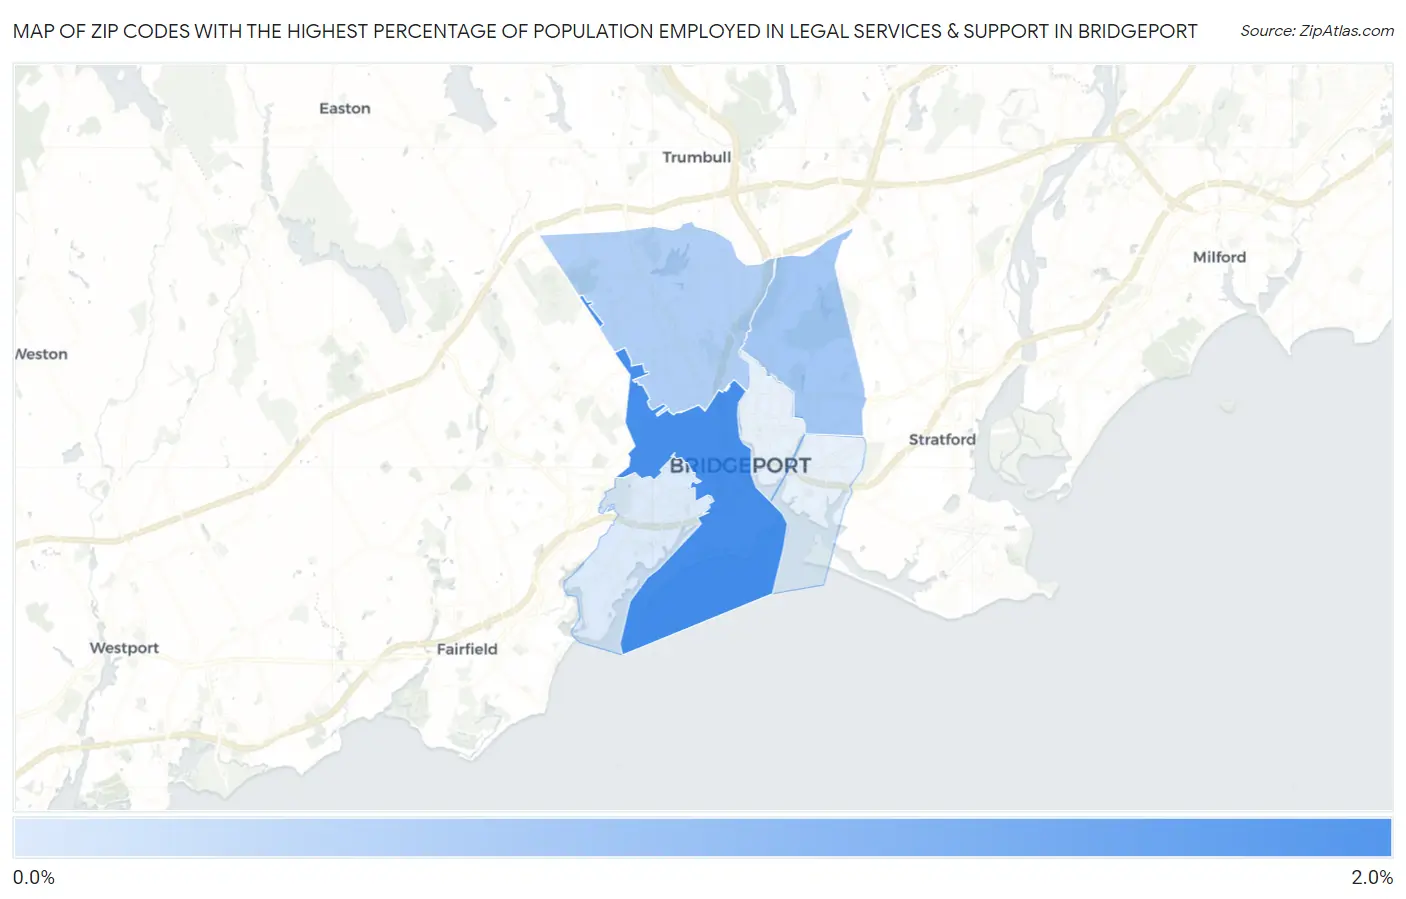
Map of Zip Codes with the Highest Percentage of Population Employed in Legal Services & Support in Bridgeport
0.25%
1.7%
Zip Codes with the Highest Percentage of Population Employed in Legal Services & Support in Bridgeport, CT
| Zip Code | % Employed | vs State | vs National | |
| 1. | 06604 | 1.7% | 1.4%(+0.293)#84 | 1.2%(+0.527)#4,284 |
| 2. | 06610 | 0.81% | 1.4%(-0.607)#156 | 1.2%(-0.373)#9,349 |
| 3. | 06606 | 0.67% | 1.4%(-0.743)#168 | 1.2%(-0.509)#10,676 |
| 4. | 06605 | 0.25% | 1.4%(-1.17)#220 | 1.2%(-0.937)#15,670 |
1
Common Questions
What are the Top 5 Zip Codes with the Highest Percentage of Population Employed in Legal Services & Support in Bridgeport, CT?
Top 5 Zip Codes with the Highest Percentage of Population Employed in Legal Services & Support in Bridgeport, CT are:
What zip code has the Highest Percentage of Population Employed in Legal Services & Support in Bridgeport, CT?
06604 has the Highest Percentage of Population Employed in Legal Services & Support in Bridgeport, CT with 1.7%.
What is the Percentage of Population Employed in Legal Services & Support in Bridgeport, CT?
Percentage of Population Employed in Legal Services & Support in Bridgeport is 0.73%.
What is the Percentage of Population Employed in Legal Services & Support in Connecticut?
Percentage of Population Employed in Legal Services & Support in Connecticut is 1.4%.
What is the Percentage of Population Employed in Legal Services & Support in the United States?
Percentage of Population Employed in Legal Services & Support in the United States is 1.2%.