Zip Codes with the Highest Percentage of Population Employed in Security & Protection in Bridgeport, CT
RELATED REPORTS & OPTIONS
Security & Protection
Bridgeport
Compare Zip Codes
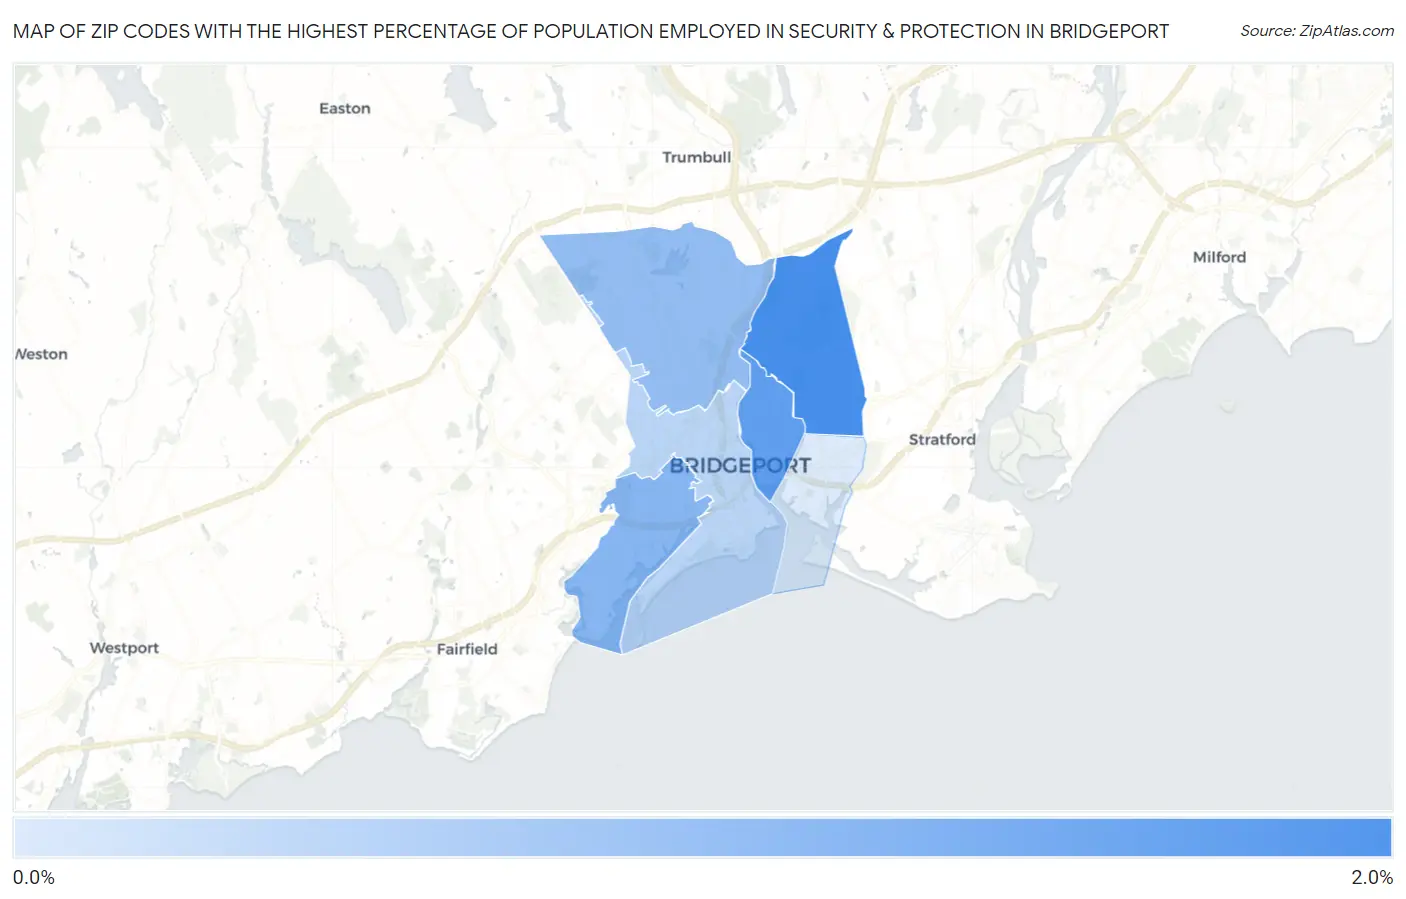
Map of Zip Codes with the Highest Percentage of Population Employed in Security & Protection in Bridgeport
0.87%
1.9%
Zip Codes with the Highest Percentage of Population Employed in Security & Protection in Bridgeport, CT
| Zip Code | % Employed | vs State | vs National | |
| 1. | 06610 | 1.9% | 1.8%(+0.076)#109 | 2.1%(-0.260)#13,317 |
| 2. | 06608 | 1.7% | 1.8%(-0.092)#122 | 2.1%(-0.429)#14,527 |
| 3. | 06605 | 1.5% | 1.8%(-0.359)#140 | 2.1%(-0.695)#16,554 |
| 4. | 06606 | 1.4% | 1.8%(-0.434)#147 | 2.1%(-0.770)#17,112 |
| 5. | 06604 | 1.1% | 1.8%(-0.712)#172 | 2.1%(-1.05)#19,275 |
| 6. | 06607 | 0.87% | 1.8%(-0.941)#192 | 2.1%(-1.28)#20,963 |
1
Common Questions
What are the Top 5 Zip Codes with the Highest Percentage of Population Employed in Security & Protection in Bridgeport, CT?
Top 5 Zip Codes with the Highest Percentage of Population Employed in Security & Protection in Bridgeport, CT are:
What zip code has the Highest Percentage of Population Employed in Security & Protection in Bridgeport, CT?
06610 has the Highest Percentage of Population Employed in Security & Protection in Bridgeport, CT with 1.9%.
What is the Percentage of Population Employed in Security & Protection in Bridgeport, CT?
Percentage of Population Employed in Security & Protection in Bridgeport is 1.4%.
What is the Percentage of Population Employed in Security & Protection in Connecticut?
Percentage of Population Employed in Security & Protection in Connecticut is 1.8%.
What is the Percentage of Population Employed in Security & Protection in the United States?
Percentage of Population Employed in Security & Protection in the United States is 2.1%.