Zip Codes with the Highest Percentage of Population with a Degree in Liberal Arts and History in Bridgeport, CT
RELATED REPORTS & OPTIONS
Liberal Arts and History
Bridgeport
Compare Zip Codes
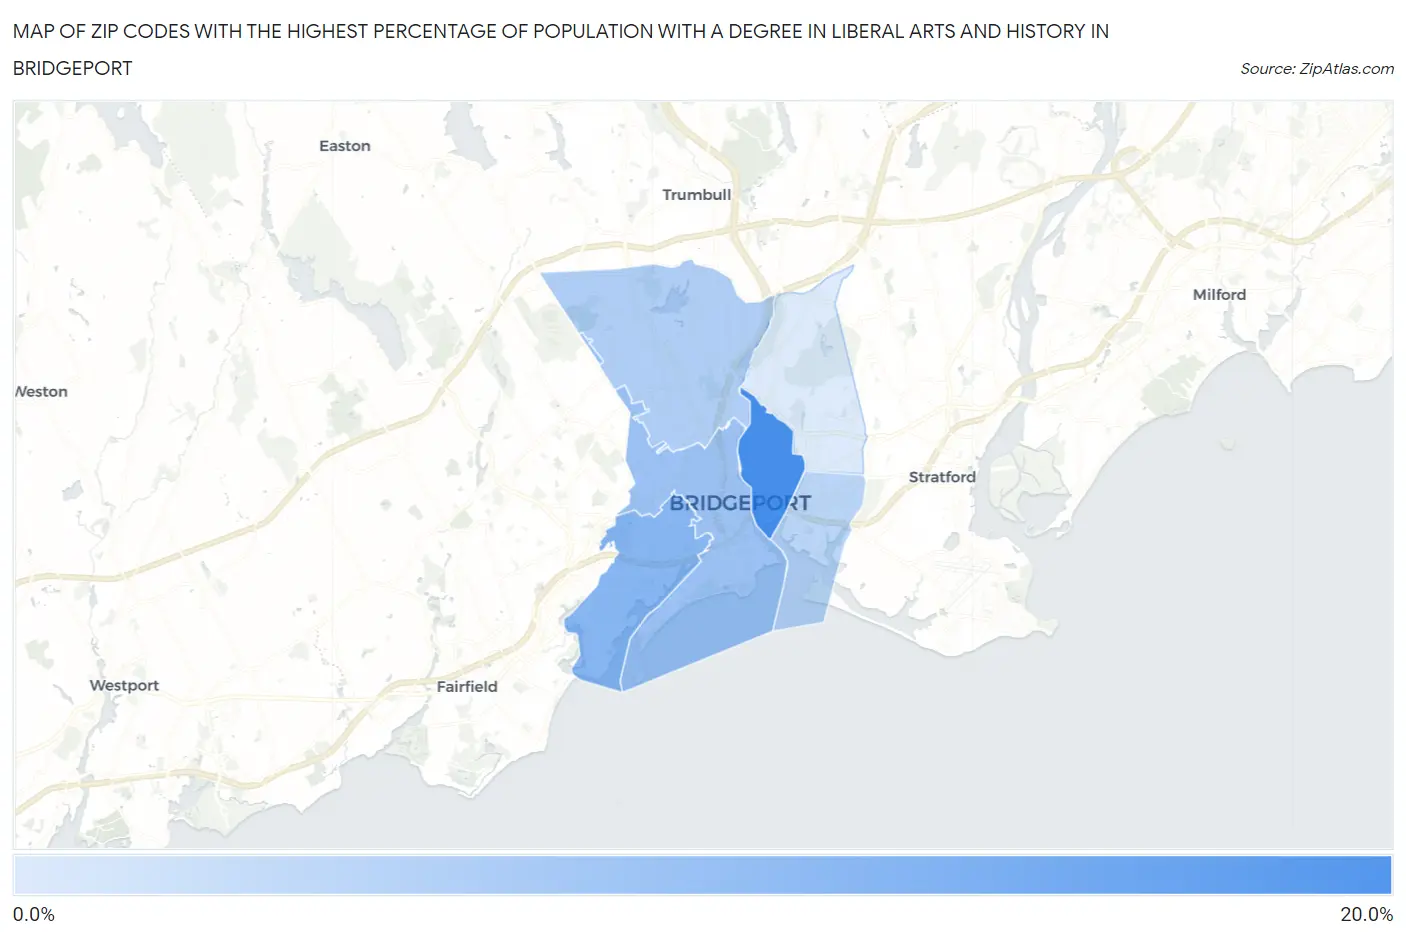
Map of Zip Codes with the Highest Percentage of Population with a Degree in Liberal Arts and History in Bridgeport
2.6%
18.3%
Zip Codes with the Highest Percentage of Population with a Degree in Liberal Arts and History in Bridgeport, CT
| Zip Code | % Graduates | vs State | vs National | |
| 1. | 06608 | 18.3% | 5.5%(+12.9)#4 | 4.9%(+13.5)#995 |
| 2. | 06605 | 11.3% | 5.5%(+5.82)#14 | 4.9%(+6.44)#2,435 |
| 3. | 06604 | 9.1% | 5.5%(+3.58)#25 | 4.9%(+4.19)#3,796 |
| 4. | 06606 | 7.2% | 5.5%(+1.72)#55 | 4.9%(+2.33)#6,040 |
| 5. | 06607 | 6.1% | 5.5%(+0.591)#99 | 4.9%(+1.21)#8,319 |
| 6. | 06610 | 2.6% | 5.5%(-2.89)#229 | 4.9%(-2.27)#19,654 |
1
Common Questions
What are the Top 5 Zip Codes with the Highest Percentage of Population with a Degree in Liberal Arts and History in Bridgeport, CT?
Top 5 Zip Codes with the Highest Percentage of Population with a Degree in Liberal Arts and History in Bridgeport, CT are:
What zip code has the Highest Percentage of Population with a Degree in Liberal Arts and History in Bridgeport, CT?
06608 has the Highest Percentage of Population with a Degree in Liberal Arts and History in Bridgeport, CT with 18.3%.
What is the Percentage of Population with a Degree in Liberal Arts and History in Bridgeport, CT?
Percentage of Population with a Degree in Liberal Arts and History in Bridgeport is 8.3%.
What is the Percentage of Population with a Degree in Liberal Arts and History in Connecticut?
Percentage of Population with a Degree in Liberal Arts and History in Connecticut is 5.5%.
What is the Percentage of Population with a Degree in Liberal Arts and History in the United States?
Percentage of Population with a Degree in Liberal Arts and History in the United States is 4.9%.