Zip Codes with the Highest Percentage of Population Enrolled in Private School in Bridgeport, CT

RELATED REPORTS & OPTIONS

In Private School
Population
Families and Households
Female Fertility
Female Fertility (Unmarried)
Race (Community Size)
Race (Percentage)
Ancestry (Community Size)
AfricanAlbanianAmericanArabArgentineanArmenianAustrianBahamianBarbadianBelgianBelizeanBlackfeetBrazilianBritishBritish West IndianBurmeseCanadianCape VerdeanCentral AmericanCentral American IndianCherokeeChileanColombianCosta RicanCroatianCubanCzechCzechoslovakianDanishDominicanDutchEastern EuropeanEcuadorianEnglishEthiopianEuropeanFrenchFrench CanadianGermanGhanaianGreekGuatemalanGuyaneseHaitianHonduranHungarianIndian (Asian)IrishItalianJamaicanJapaneseJordanianKoreanLaotianLebaneseLiberianLithuanianMalaysianMexicanMexican American IndianNicaraguanNigerianNorthern EuropeanNorwegianPakistaniPanamanianPeruvianPolishPortuguesePuerto RicanRomanianRussianSalvadoranSamoanScotch-IrishScottishSlavicSlovakSouth AmericanSouth American IndianSpaniardSpanishSri LankanSubsaharan AfricanSwedishSyrianThaiTrinidadian and TobagonianU.S. Virgin IslanderUkrainianUruguayanVenezuelanVietnameseWelshWest Indian
Ancestry (Percentage)
AfricanAlbanianAmericanArabArgentineanArmenianAustrianBahamianBarbadianBelgianBelizeanBlackfeetBrazilianBritishBritish West IndianBurmeseCanadianCape VerdeanCentral AmericanCentral American IndianCherokeeChileanColombianCosta RicanCroatianCubanCzechCzechoslovakianDanishDominicanDutchEastern EuropeanEcuadorianEnglishEthiopianEuropeanFrenchFrench CanadianGermanGhanaianGreekGuatemalanGuyaneseHaitianHonduranHungarianIndian (Asian)IrishItalianJamaicanJapaneseJordanianKoreanLaotianLebaneseLiberianLithuanianMalaysianMexicanMexican American IndianNicaraguanNigerianNorthern EuropeanNorwegianPakistaniPanamanianPeruvianPolishPortuguesePuerto RicanRomanianRussianSalvadoranSamoanScotch-IrishScottishSlavicSlovakSouth AmericanSouth American IndianSpaniardSpanishSri LankanSubsaharan AfricanSwedishSyrianThaiTrinidadian and TobagonianU.S. Virgin IslanderUkrainianUruguayanVenezuelanVietnameseWelshWest Indian
Immigrant Origin (Total)
Immigrant Origin (Percentage)
Income
Income (Families)
Income (Households)
Poverty
Poverty (Families)
Unemployment
Employment Occupations
Employment Industries
Employer Class
Commute Time
Commute Means
School Enrollment
Education by Degree Field
Occupancy
Finances
Physical Characteristics
Bridgeport
Compare Zip Codes
Comparison Subject

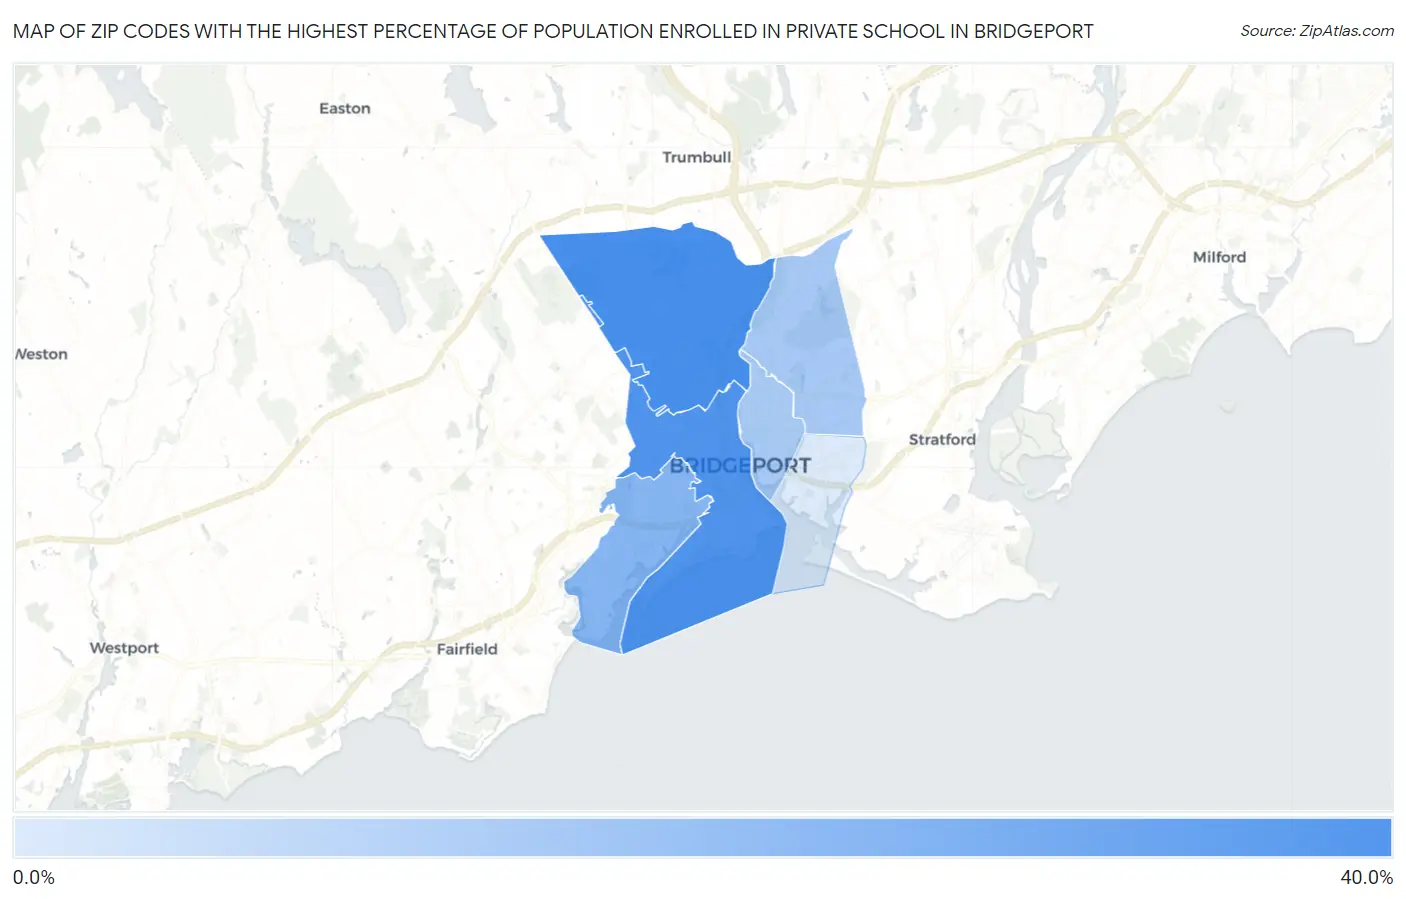
Map of Zip Codes with the Highest Percentage of Population Enrolled in Private School in Bridgeport

0.0%
40.0%
Zip Codes with the Highest Percentage of Population Enrolled in Private School in Bridgeport Map

Zip Codes with the Highest Percentage of Population Enrolled in Private School in Bridgeport, CT

Zip Code % in Private School vs State vs National
1.0660634.1%20.4%(+13.7)#3017.3%(+16.8)#2,670
2.0660432.8%20.4%(+12.4)#3317.3%(+15.5)#2,941
3.0660522.4%20.4%(+2.00)#7817.3%(+5.10)#6,726
4.0661016.8%20.4%(-3.60)#13617.3%(-0.500)#11,306
5.0660816.5%20.4%(-3.90)#14217.3%(-0.800)#11,643
6.066078.0%20.4%(-12.4)#24617.3%(-9.30)#21,589

Common Questions

What are the Top 5 Zip Codes with the Highest Percentage of Population Enrolled in Private School in Bridgeport, CT?
Top 5 Zip Codes with the Highest Percentage of Population Enrolled in Private School in Bridgeport, CT are:
#1
34.1%
#2
32.8%
#3
22.4%
#4
16.8%
#5
16.5%
What zip code has the Highest Percentage of Population Enrolled in Private School in Bridgeport, CT?
06606 has the Highest Percentage of Population Enrolled in Private School in Bridgeport, CT with 34.1%.
What is the Percentage of Population Enrolled in Private School in Bridgeport, CT?
Percentage of Population Enrolled in Private School in Bridgeport is 26.8%.
What is the Percentage of Population Enrolled in Private School in Connecticut?
Percentage of Population Enrolled in Private School in Connecticut is 20.4%.
What is the Percentage of Population Enrolled in Private School in the United States?
Percentage of Population Enrolled in Private School in the United States is 17.3%.