Zip Codes with the Highest Percentage of Population with a Degree in Visual and Performing Arts in Hamden, CT
RELATED REPORTS & OPTIONS
Visual and Performing Arts
Hamden
Compare Zip Codes
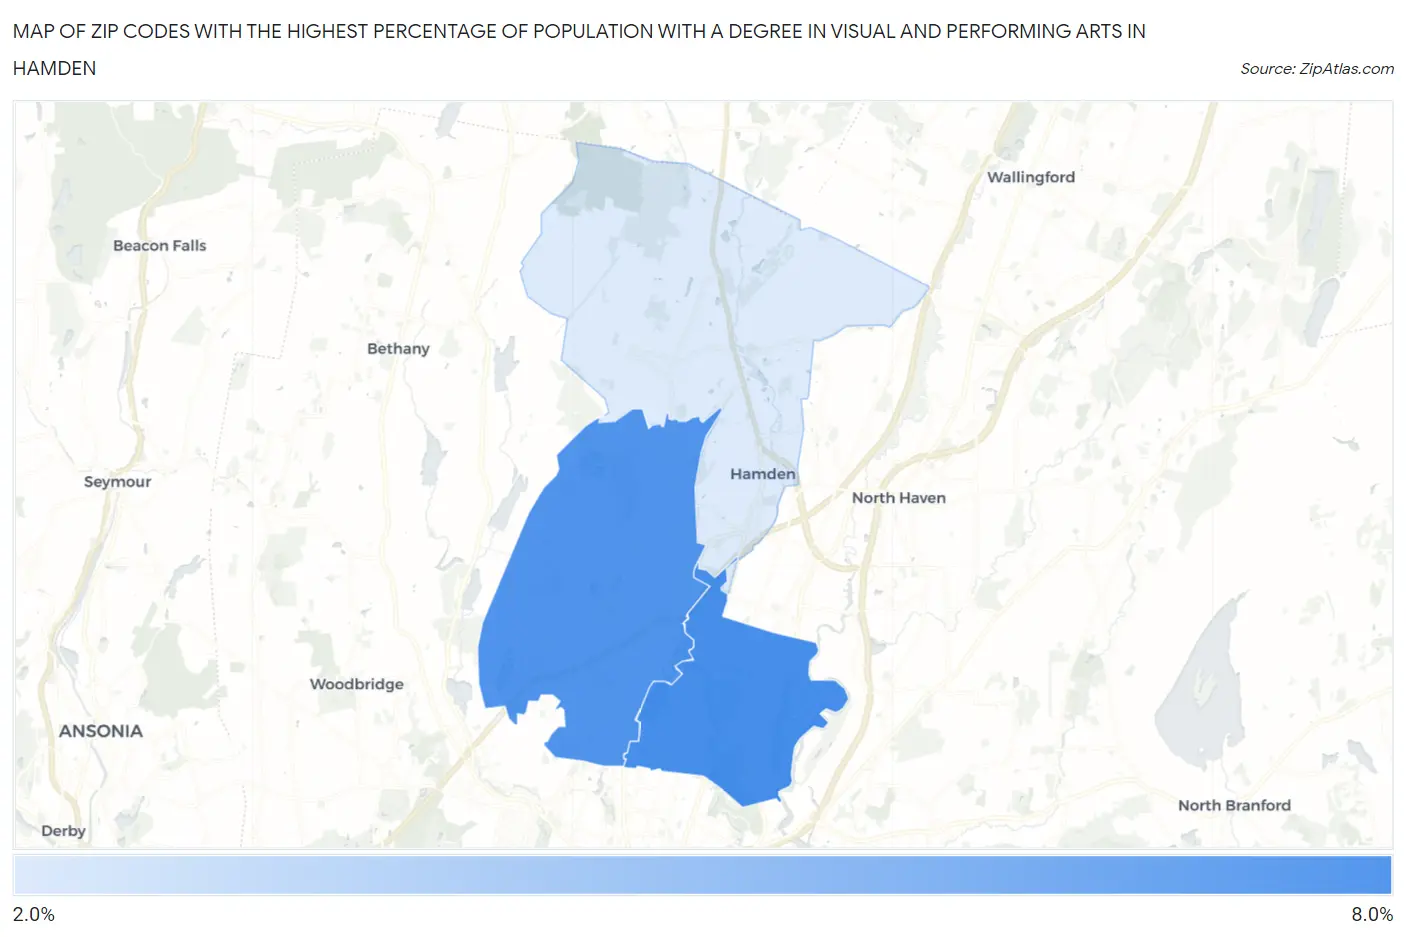
Map of Zip Codes with the Highest Percentage of Population with a Degree in Visual and Performing Arts in Hamden
2.0%
6.3%
Zip Codes with the Highest Percentage of Population with a Degree in Visual and Performing Arts in Hamden, CT
| Zip Code | % Graduates | vs State | vs National | |
| 1. | 06517 | 6.3% | 4.7%(+1.58)#67 | 4.3%(+2.05)#4,468 |
| 2. | 06514 | 6.0% | 4.7%(+1.30)#75 | 4.3%(+1.76)#4,854 |
| 3. | 06518 | 2.0% | 4.7%(-2.67)#228 | 4.3%(-2.20)#16,266 |
1
Common Questions
What are the Top Zip Codes with the Highest Percentage of Population with a Degree in Visual and Performing Arts in Hamden, CT?
Top Zip Codes with the Highest Percentage of Population with a Degree in Visual and Performing Arts in Hamden, CT are:
What zip code has the Highest Percentage of Population with a Degree in Visual and Performing Arts in Hamden, CT?
06517 has the Highest Percentage of Population with a Degree in Visual and Performing Arts in Hamden, CT with 6.3%.
What is the Percentage of Population with a Degree in Visual and Performing Arts in Connecticut?
Percentage of Population with a Degree in Visual and Performing Arts in Connecticut is 4.7%.
What is the Percentage of Population with a Degree in Visual and Performing Arts in the United States?
Percentage of Population with a Degree in Visual and Performing Arts in the United States is 4.3%.