Zip Codes with the Highest Percentage of Population with a Degree in Visual and Performing Arts in Arvada, CO
RELATED REPORTS & OPTIONS
Visual and Performing Arts
Arvada
Compare Zip Codes
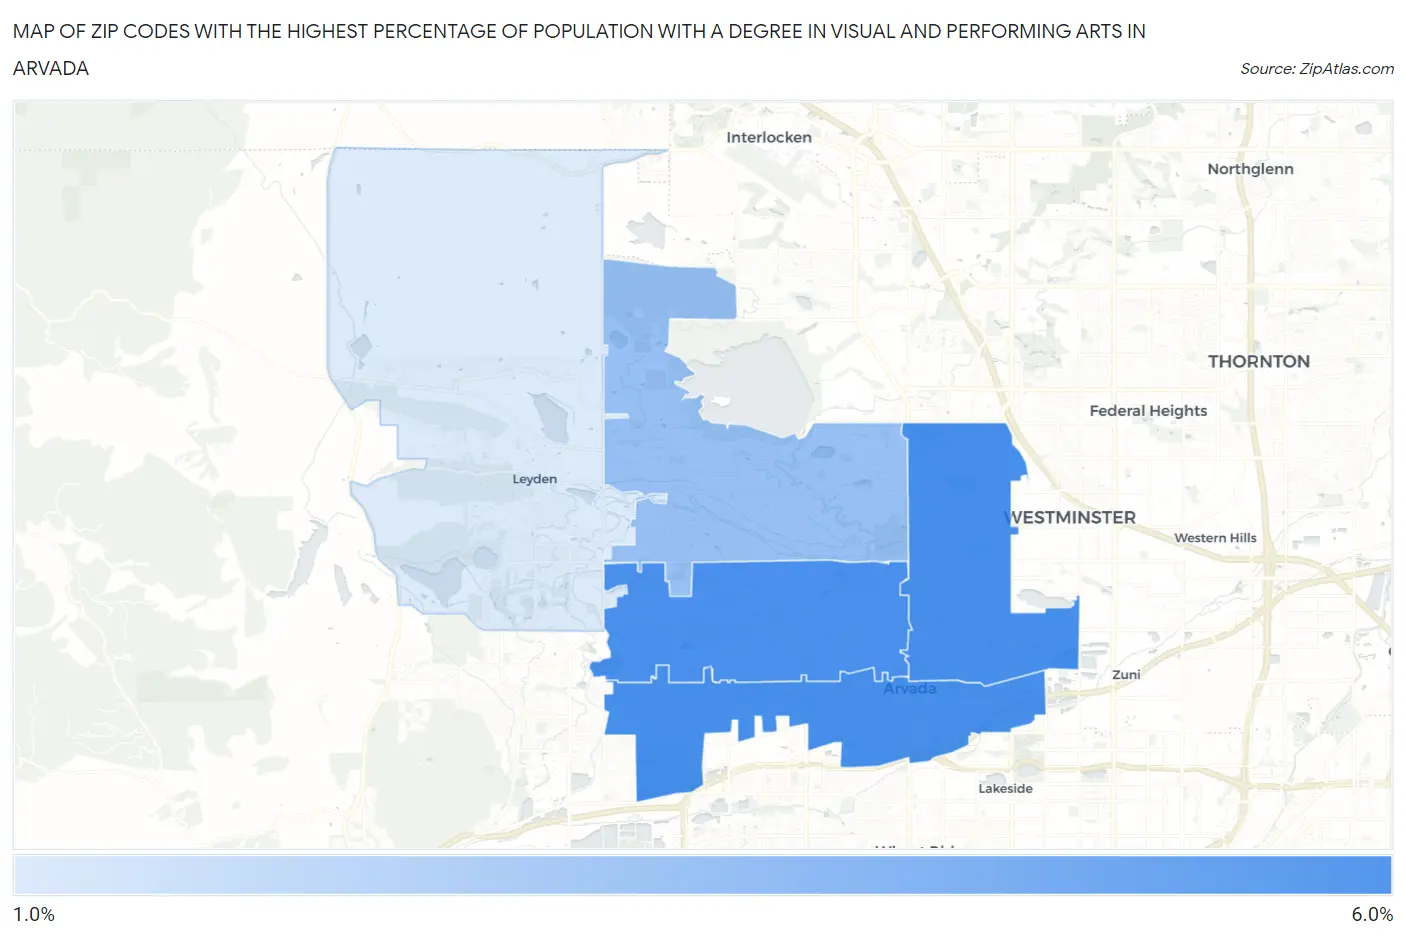
Map of Zip Codes with the Highest Percentage of Population with a Degree in Visual and Performing Arts in Arvada
1.6%
5.6%
Zip Codes with the Highest Percentage of Population with a Degree in Visual and Performing Arts in Arvada, CO
| Zip Code | % Graduates | vs State | vs National | |
| 1. | 80003 | 5.6% | 4.3%(+1.29)#104 | 4.3%(+1.36)#5,470 |
| 2. | 80002 | 5.6% | 4.3%(+1.28)#105 | 4.3%(+1.36)#5,484 |
| 3. | 80004 | 5.5% | 4.3%(+1.20)#117 | 4.3%(+1.27)#5,637 |
| 4. | 80005 | 3.5% | 4.3%(-0.862)#216 | 4.3%(-0.787)#11,013 |
| 5. | 80007 | 1.6% | 4.3%(-2.68)#316 | 4.3%(-2.61)#17,685 |
1
Common Questions
What are the Top 3 Zip Codes with the Highest Percentage of Population with a Degree in Visual and Performing Arts in Arvada, CO?
Top 3 Zip Codes with the Highest Percentage of Population with a Degree in Visual and Performing Arts in Arvada, CO are:
What zip code has the Highest Percentage of Population with a Degree in Visual and Performing Arts in Arvada, CO?
80003 has the Highest Percentage of Population with a Degree in Visual and Performing Arts in Arvada, CO with 5.6%.
What is the Percentage of Population with a Degree in Visual and Performing Arts in Arvada, CO?
Percentage of Population with a Degree in Visual and Performing Arts in Arvada is 4.4%.
What is the Percentage of Population with a Degree in Visual and Performing Arts in Colorado?
Percentage of Population with a Degree in Visual and Performing Arts in Colorado is 4.3%.
What is the Percentage of Population with a Degree in Visual and Performing Arts in the United States?
Percentage of Population with a Degree in Visual and Performing Arts in the United States is 4.3%.