Zip Codes with the Highest Percentage of Population Employed in Health Diagnosing & Treating in Longmont, CO
RELATED REPORTS & OPTIONS
Health Diagnosing & Treating
Longmont
Compare Zip Codes
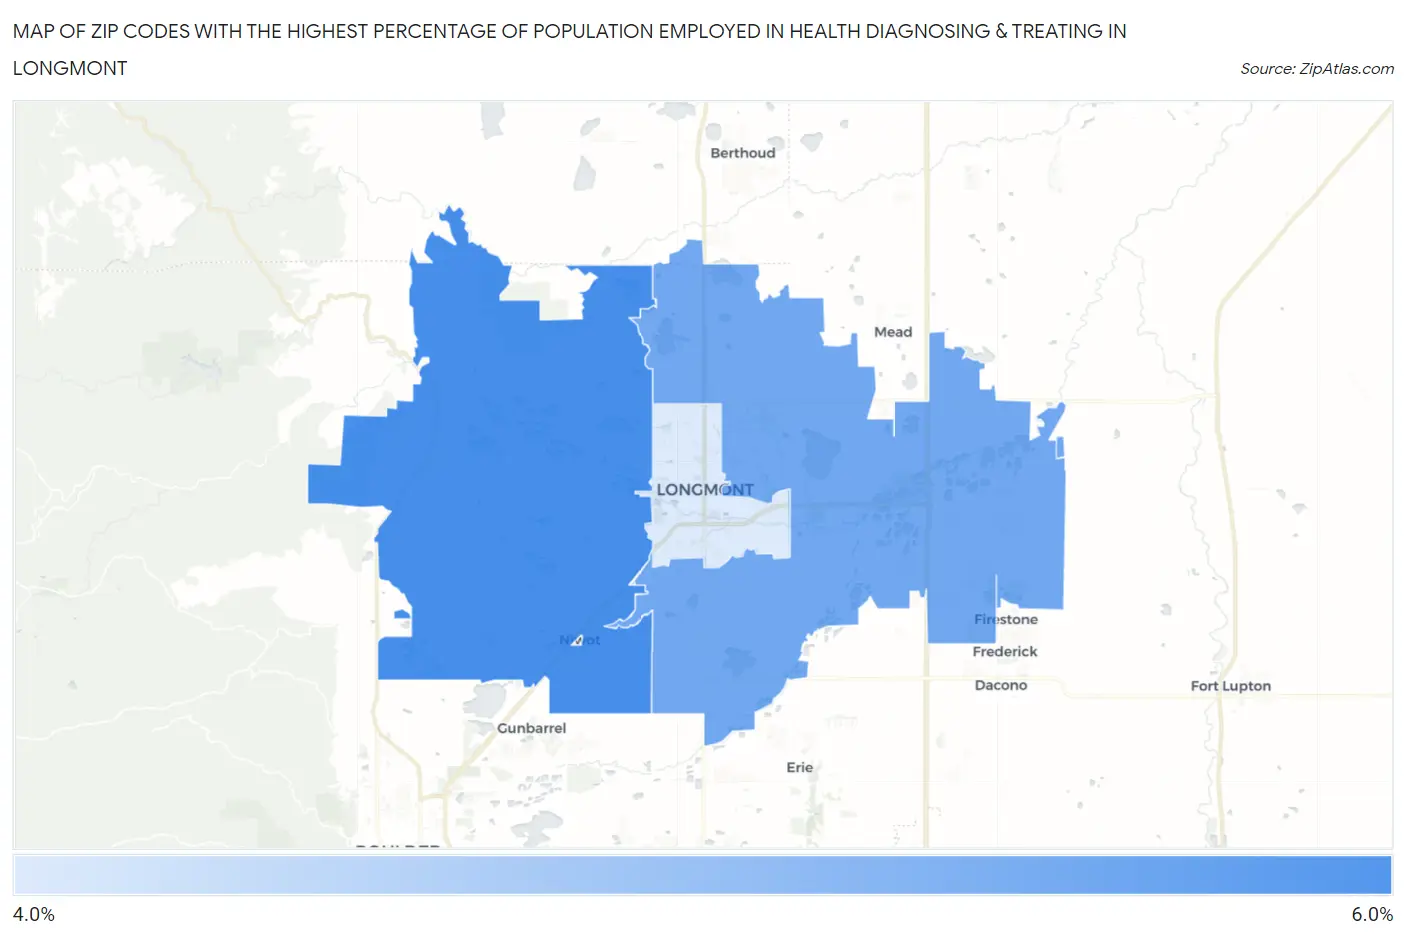
Map of Zip Codes with the Highest Percentage of Population Employed in Health Diagnosing & Treating in Longmont
4.1%
5.8%
Zip Codes with the Highest Percentage of Population Employed in Health Diagnosing & Treating in Longmont, CO
| Zip Code | % Employed | vs State | vs National | |
| 1. | 80503 | 5.8% | 5.8%(-0.019)#199 | 6.2%(-0.456)#14,654 |
| 2. | 80504 | 5.3% | 5.8%(-0.490)#234 | 6.2%(-0.927)#16,488 |
| 3. | 80501 | 4.1% | 5.8%(-1.75)#300 | 6.2%(-2.19)#21,195 |
1
Common Questions
What are the Top Zip Codes with the Highest Percentage of Population Employed in Health Diagnosing & Treating in Longmont, CO?
Top Zip Codes with the Highest Percentage of Population Employed in Health Diagnosing & Treating in Longmont, CO are:
What zip code has the Highest Percentage of Population Employed in Health Diagnosing & Treating in Longmont, CO?
80503 has the Highest Percentage of Population Employed in Health Diagnosing & Treating in Longmont, CO with 5.8%.
What is the Percentage of Population Employed in Health Diagnosing & Treating in Longmont, CO?
Percentage of Population Employed in Health Diagnosing & Treating in Longmont is 4.8%.
What is the Percentage of Population Employed in Health Diagnosing & Treating in Colorado?
Percentage of Population Employed in Health Diagnosing & Treating in Colorado is 5.8%.
What is the Percentage of Population Employed in Health Diagnosing & Treating in the United States?
Percentage of Population Employed in Health Diagnosing & Treating in the United States is 6.2%.