Zip Codes with the Highest Percentage of Population with a Degree in Computers and Mathematics in Colorado Springs, CO

RELATED REPORTS & OPTIONS

Computers and Mathematics
Population
Families and Households
Female Fertility
Female Fertility (Unmarried)
Race (Community Size)
Race (Percentage)
Ancestry (Community Size)
AfghanAfricanAlaskan AthabascanAlbanianAlsatianAmericanApacheArabArapahoArgentineanArmenianAustralianAustrianBangladeshiBarbadianBasqueBelgianBelizeanBermudanBhutaneseBlackfeetBolivianBrazilianBritishBritish West IndianBulgarianBurmeseCajunCambodianCanadianCape VerdeanCarpatho RusynCelticCentral AmericanCentral American IndianCherokeeCheyenneChickasawChileanChineseChippewaChoctawColombianComancheCosta RicanCreeCreekCroatianCubanCzechCzechoslovakianDanishDelawareDominicanDutchEastern EuropeanEcuadorianEgyptianEnglishEstonianEthiopianEuropeanFilipinoFinnishFrenchFrench CanadianGermanGerman RussianGhanaianGreekGuamanian / ChamorroGuatemalanHaitianHonduranHopiHungarianIcelanderIndian (Asian)IndonesianInupiatIranianIraqiIrishIroquoisIsraeliItalianJamaicanJapaneseJordanianKenyanKoreanLaotianLatvianLebaneseLiberianLithuanianLuxembourgerMacedonianMalaysianMexicanMexican American IndianNative HawaiianNavajoNew ZealanderNicaraguanNigerianNorthern EuropeanNorwegianOkinawanOsagePakistaniPalestinianPanamanianPennsylvania GermanPeruvianPolishPortuguesePotawatomiPuebloPuerto RicanRomanianRussianSalvadoranSamoanScandinavianScotch-IrishScottishSeminoleSerbianShoshoneSiouxSlavicSlovakSloveneSomaliSouth AfricanSouth AmericanSouth American IndianSpaniardSpanishSpanish AmericanSpanish American IndianSri LankanSubsaharan AfricanSudaneseSwedishSwissSyrianThaiTohono O'OdhamTrinidadian and TobagonianTurkishUkrainianUteVenezuelanWelshWest IndianYaquiYugoslavian
Ancestry (Percentage)
AfghanAfricanAlaskan AthabascanAlbanianAlsatianAmericanApacheArabArapahoArgentineanArmenianAustralianAustrianBangladeshiBarbadianBasqueBelgianBelizeanBermudanBhutaneseBlackfeetBolivianBrazilianBritishBritish West IndianBulgarianBurmeseCajunCambodianCanadianCape VerdeanCarpatho RusynCelticCentral AmericanCentral American IndianCherokeeCheyenneChickasawChileanChineseChippewaChoctawColombianComancheCosta RicanCreeCreekCroatianCubanCzechCzechoslovakianDanishDelawareDominicanDutchEastern EuropeanEcuadorianEgyptianEnglishEstonianEthiopianEuropeanFilipinoFinnishFrenchFrench CanadianGermanGerman RussianGhanaianGreekGuamanian / ChamorroGuatemalanHaitianHonduranHopiHungarianIcelanderIndian (Asian)IndonesianInupiatIranianIraqiIrishIroquoisIsraeliItalianJamaicanJapaneseJordanianKenyanKoreanLaotianLatvianLebaneseLiberianLithuanianLuxembourgerMacedonianMalaysianMexicanMexican American IndianNative HawaiianNavajoNew ZealanderNicaraguanNigerianNorthern EuropeanNorwegianOkinawanOsagePakistaniPalestinianPanamanianPennsylvania GermanPeruvianPolishPortuguesePotawatomiPuebloPuerto RicanRomanianRussianSalvadoranSamoanScandinavianScotch-IrishScottishSeminoleSerbianShoshoneSiouxSlavicSlovakSloveneSomaliSouth AfricanSouth AmericanSouth American IndianSpaniardSpanishSpanish AmericanSpanish American IndianSri LankanSubsaharan AfricanSudaneseSwedishSwissSyrianThaiTohono O'OdhamTrinidadian and TobagonianTurkishUkrainianUteVenezuelanWelshWest IndianYaquiYugoslavian
Immigrant Origin (Total)
AfghanistanAfricaArgentinaArmeniaAsiaAustraliaAustriaBangladeshBarbadosBelarusBoliviaBosnia and HerzegovinaBrazilBulgariaBurma / MyanmarCambodiaCameroonCanadaCaribbeanCentral AmericaChileChinaColombiaCosta RicaCroatiaCubaCzechoslovakiaDenmarkDominican RepublicEastern AfricaEastern AsiaEastern EuropeEcuadorEgyptEl SalvadorEnglandEritreaEthiopiaEuropeFranceGermanyGhanaGuatemalaGuyanaHaitiHondurasHong KongHungaryIndiaIndonesiaIranIraqIrelandIsraelItalyJamaicaJapanKazakhstanKenyaKoreaLaosLatin AmericaLebanonLiberiaLithuaniaMexicoMiddle AfricaMoldovaNepalNetherlandsNicaraguaNigeriaNorth MacedoniaNorthern AfricaNorthern EuropeNorwayOceaniaPakistanPanamaPeruPhilippinesPolandRomaniaRussiaScotlandSingaporeSomaliaSouth AfricaSouth AmericaSouth Central AsiaSouth Eastern AsiaSouthern EuropeSpainSt. Vincent and the GrenadinesSwedenSwitzerlandSyriaTaiwanThailandTrinidad and TobagoTurkeyUgandaUkraineUzbekistanVenezuelaVietnamWest IndiesWestern AfricaWestern AsiaWestern EuropeZaireZimbabwe
Immigrant Origin (Percentage)
AfghanistanAfricaArgentinaArmeniaAsiaAustraliaAustriaBangladeshBarbadosBelarusBoliviaBosnia and HerzegovinaBrazilBulgariaBurma / MyanmarCambodiaCameroonCanadaCaribbeanCentral AmericaChileChinaColombiaCosta RicaCroatiaCubaCzechoslovakiaDenmarkDominican RepublicEastern AfricaEastern AsiaEastern EuropeEcuadorEgyptEl SalvadorEnglandEritreaEthiopiaEuropeFranceGermanyGhanaGuatemalaGuyanaHaitiHondurasHong KongHungaryIndiaIndonesiaIranIraqIrelandIsraelItalyJamaicaJapanKazakhstanKenyaKoreaLaosLatin AmericaLebanonLiberiaLithuaniaMexicoMiddle AfricaMoldovaNepalNetherlandsNicaraguaNigeriaNorth MacedoniaNorthern AfricaNorthern EuropeNorwayOceaniaPakistanPanamaPeruPhilippinesPolandRomaniaRussiaScotlandSingaporeSomaliaSouth AfricaSouth AmericaSouth Central AsiaSouth Eastern AsiaSouthern EuropeSpainSt. Vincent and the GrenadinesSwedenSwitzerlandSyriaTaiwanThailandTrinidad and TobagoTurkeyUgandaUkraineUzbekistanVenezuelaVietnamWest IndiesWestern AfricaWestern AsiaWestern EuropeZaireZimbabwe
Income
Income (Families)
Income (Households)
Poverty
Poverty (Families)
Unemployment
Employment Occupations
Employment Industries
Employer Class
Commute Time
Commute Means
School Enrollment
Education by Degree Field
Occupancy
Finances
Physical Characteristics
Colorado Springs
Compare Zip Codes
Comparison Subject

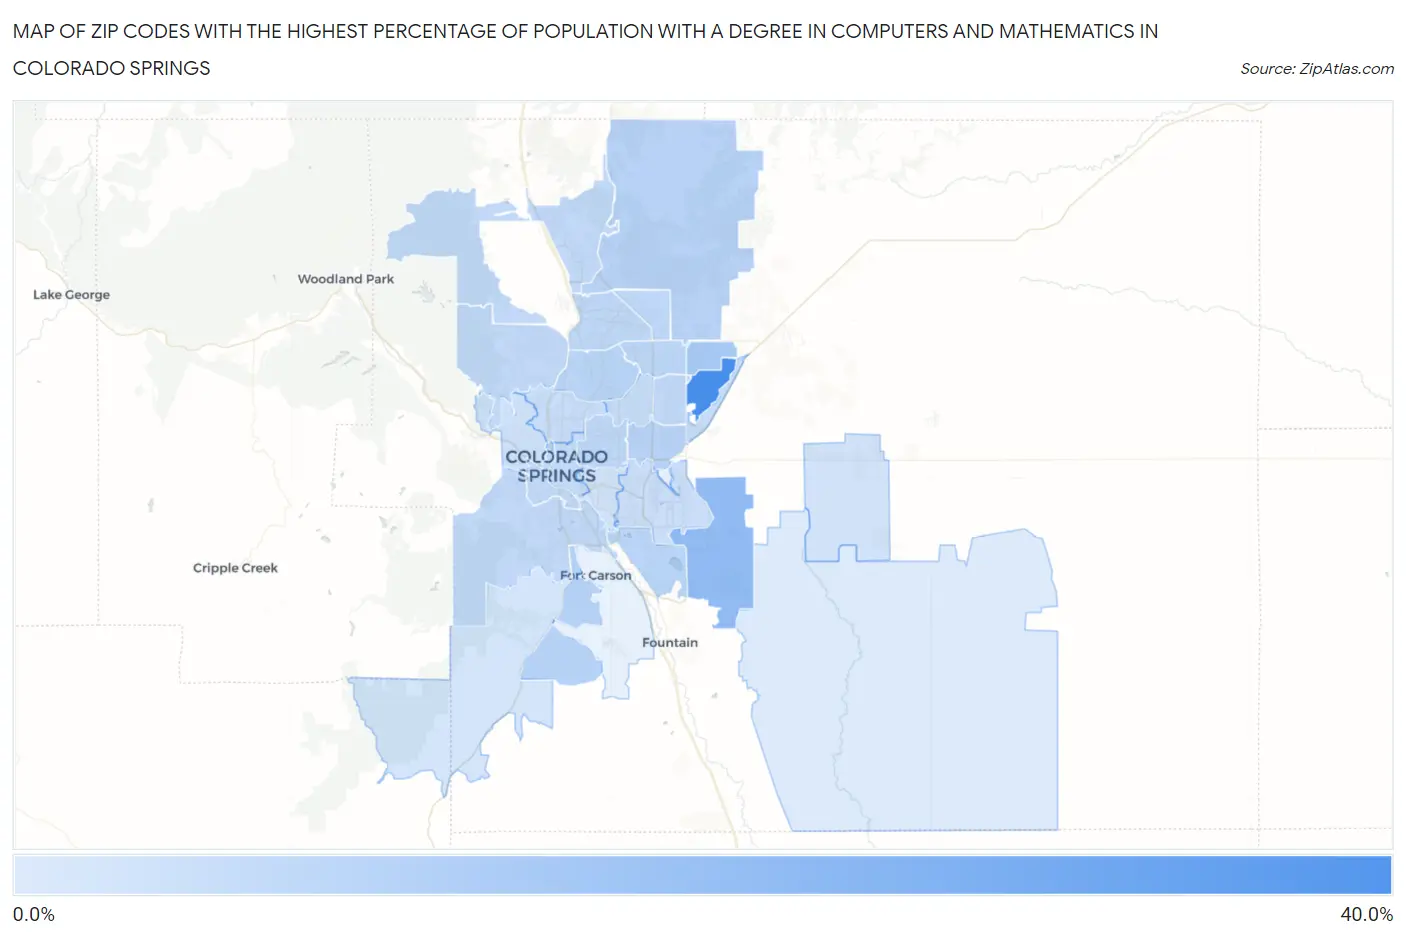
Map of Zip Codes with the Highest Percentage of Population with a Degree in Computers and Mathematics in Colorado Springs

0.0%
40.0%
Zip Codes with the Highest Percentage of Population with a Degree in Computers and Mathematics in Colorado Springs Map

Zip Codes with the Highest Percentage of Population with a Degree in Computers and Mathematics in Colorado Springs, CO

Zip Code % Graduates vs State vs National
1.8093833.2%5.2%(+28.1)#64.9%(+28.3)#195
2.8092516.3%5.2%(+11.1)#144.9%(+11.4)#679
3.8092711.5%5.2%(+6.32)#234.9%(+6.59)#1,331
4.809028.7%5.2%(+3.50)#414.9%(+3.77)#2,443
5.809088.3%5.2%(+3.16)#434.9%(+3.43)#2,652
6.809158.3%5.2%(+3.11)#464.9%(+3.39)#2,685
7.809188.1%5.2%(+2.91)#504.9%(+3.18)#2,841
8.809117.9%5.2%(+2.70)#554.9%(+2.97)#3,006
9.809237.4%5.2%(+2.21)#634.9%(+2.49)#3,456
10.809247.2%5.2%(+2.06)#704.9%(+2.33)#3,597
11.809207.0%5.2%(+1.86)#824.9%(+2.13)#3,792
12.809097.0%5.2%(+1.84)#844.9%(+2.11)#3,823
13.809226.7%5.2%(+1.57)#974.9%(+1.85)#4,155
14.809216.7%5.2%(+1.54)#984.9%(+1.81)#4,198
15.809066.7%5.2%(+1.50)#994.9%(+1.77)#4,237
16.809196.4%5.2%(+1.23)#1044.9%(+1.51)#4,609
17.809056.4%5.2%(+1.21)#1074.9%(+1.48)#4,650
18.809175.9%5.2%(+0.738)#1254.9%(+1.01)#5,469
19.809035.8%5.2%(+0.610)#1304.9%(+0.883)#5,718
20.809515.7%5.2%(+0.578)#1344.9%(+0.851)#5,784
21.809075.2%5.2%(+0.038)#1584.9%(+0.311)#6,977
22.809164.8%5.2%(-0.324)#1704.9%(-0.051)#7,868
23.809044.0%5.2%(-1.21)#2164.9%(-0.939)#10,604
24.809103.7%5.2%(-1.51)#2354.9%(-1.24)#11,687
25.809303.3%5.2%(-1.86)#2544.9%(-1.59)#13,015
26.809263.0%5.2%(-2.16)#2764.9%(-1.89)#14,089
27.809281.3%5.2%(-3.84)#3334.9%(-3.57)#19,648

Common Questions

What are the Top 10 Zip Codes with the Highest Percentage of Population with a Degree in Computers and Mathematics in Colorado Springs, CO?
Top 10 Zip Codes with the Highest Percentage of Population with a Degree in Computers and Mathematics in Colorado Springs, CO are:
#1
33.2%
#2
16.3%
#3
11.5%
#4
8.7%
#5
8.3%
#6
8.3%
#7
8.1%
#8
7.9%
#9
7.4%
#10
7.2%
What zip code has the Highest Percentage of Population with a Degree in Computers and Mathematics in Colorado Springs, CO?
80938 has the Highest Percentage of Population with a Degree in Computers and Mathematics in Colorado Springs, CO with 33.2%.
What is the Percentage of Population with a Degree in Computers and Mathematics in Colorado Springs, CO?
Percentage of Population with a Degree in Computers and Mathematics in Colorado Springs is 6.6%.
What is the Percentage of Population with a Degree in Computers and Mathematics in Colorado?
Percentage of Population with a Degree in Computers and Mathematics in Colorado is 5.2%.
What is the Percentage of Population with a Degree in Computers and Mathematics in the United States?
Percentage of Population with a Degree in Computers and Mathematics in the United States is 4.9%.