Zip Codes with the Highest Percentage of Population Employed in Health Diagnosing & Treating in San Clemente, CA
RELATED REPORTS & OPTIONS
Health Diagnosing & Treating
San Clemente
Compare Zip Codes
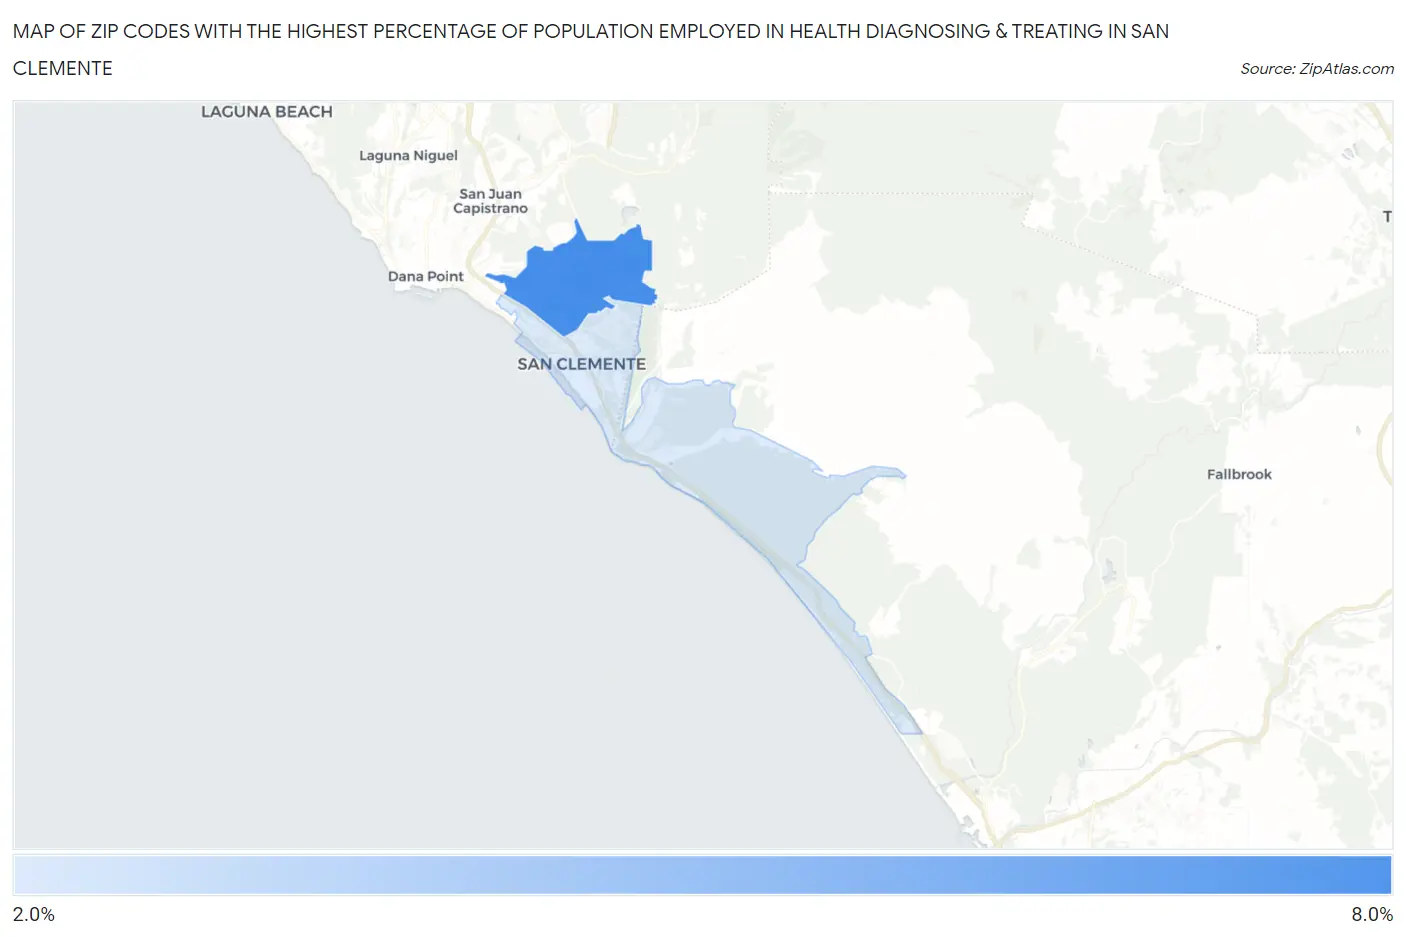
Map of Zip Codes with the Highest Percentage of Population Employed in Health Diagnosing & Treating in San Clemente
3.0%
6.9%
Zip Codes with the Highest Percentage of Population Employed in Health Diagnosing & Treating in San Clemente, CA
| Zip Code | % Employed | vs State | vs National | |
| 1. | 92673 | 6.9% | 5.3%(+1.61)#397 | 6.2%(+0.673)#10,625 |
| 2. | 92672 | 3.0% | 5.3%(-2.32)#1,195 | 6.2%(-3.25)#24,342 |
1
Common Questions
What are the Top Zip Codes with the Highest Percentage of Population Employed in Health Diagnosing & Treating in San Clemente, CA?
Top Zip Codes with the Highest Percentage of Population Employed in Health Diagnosing & Treating in San Clemente, CA are:
What zip code has the Highest Percentage of Population Employed in Health Diagnosing & Treating in San Clemente, CA?
92673 has the Highest Percentage of Population Employed in Health Diagnosing & Treating in San Clemente, CA with 6.9%.
What is the Percentage of Population Employed in Health Diagnosing & Treating in San Clemente, CA?
Percentage of Population Employed in Health Diagnosing & Treating in San Clemente is 4.8%.
What is the Percentage of Population Employed in Health Diagnosing & Treating in California?
Percentage of Population Employed in Health Diagnosing & Treating in California is 5.3%.
What is the Percentage of Population Employed in Health Diagnosing & Treating in the United States?
Percentage of Population Employed in Health Diagnosing & Treating in the United States is 6.2%.