Zip Codes with the Highest Percentage of Households with Income Above $100,000 in Tucson, AZ
RELATED REPORTS & OPTIONS
Household Income | $100k+
Tucson
Compare Zip Codes
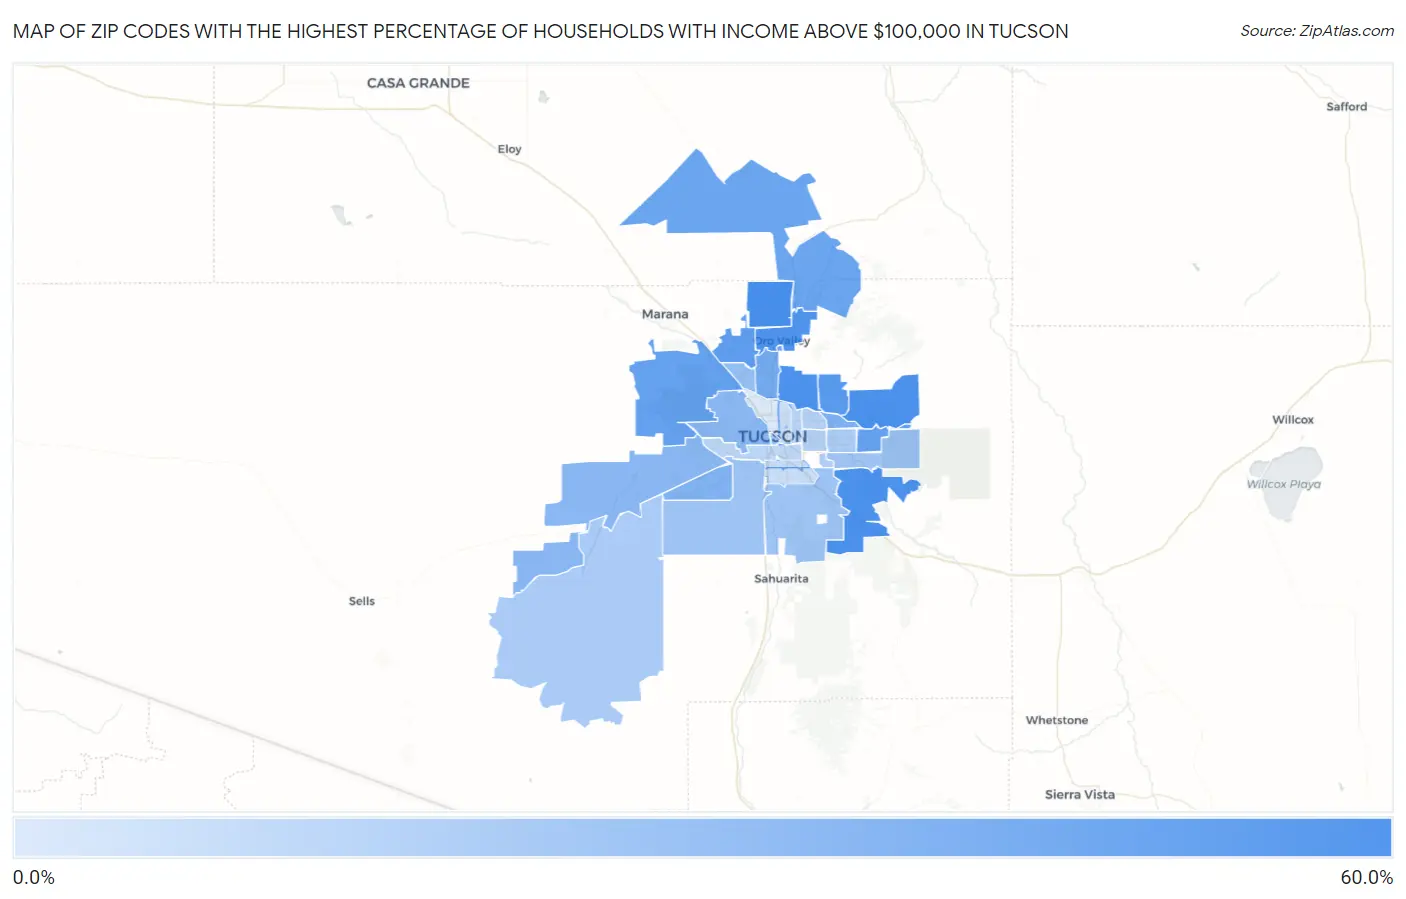
Map of Zip Codes with the Highest Percentage of Households with Income Above $100,000 in Tucson
8.0%
54.8%
Zip Codes with the Highest Percentage of Households with Income Above $100,000 in Tucson, AZ
| Zip Code | Households with Income > $100k | vs State | vs National | |
| 1. | 85755 | 54.8% | 34.8%(+20.0)#34 | 37.3%(+17.5)#3,504 |
| 2. | 85749 | 53.5% | 34.8%(+18.7)#38 | 37.3%(+16.2)#3,836 |
| 3. | 85718 | 53.0% | 34.8%(+18.2)#39 | 37.3%(+15.7)#3,961 |
| 4. | 85747 | 52.7% | 34.8%(+17.9)#40 | 37.3%(+15.4)#4,059 |
| 5. | 85737 | 51.1% | 34.8%(+16.3)#44 | 37.3%(+13.8)#4,509 |
| 6. | 85750 | 49.0% | 34.8%(+14.2)#52 | 37.3%(+11.7)#5,168 |
| 7. | 85742 | 46.3% | 34.8%(+11.5)#57 | 37.3%(+9.00)#6,083 |
| 8. | 85743 | 44.1% | 34.8%(+9.30)#68 | 37.3%(+6.80)#6,960 |
| 9. | 85748 | 43.7% | 34.8%(+8.90)#70 | 37.3%(+6.40)#7,123 |
| 10. | 85739 | 41.5% | 34.8%(+6.70)#76 | 37.3%(+4.20)#8,115 |
| 11. | 85704 | 38.4% | 34.8%(+3.60)#92 | 37.3%(+1.10)#9,748 |
| 12. | 85715 | 35.5% | 34.8%(+0.700)#113 | 37.3%(-1.80)#11,448 |
| 13. | 85757 | 34.9% | 34.8%(+0.100)#114 | 37.3%(-2.40)#11,824 |
| 14. | 85745 | 31.8% | 34.8%(-3.00)#135 | 37.3%(-5.50)#14,008 |
| 15. | 85735 | 31.5% | 34.8%(-3.30)#137 | 37.3%(-5.80)#14,249 |
| 16. | 85741 | 28.0% | 34.8%(-6.80)#173 | 37.3%(-9.30)#17,108 |
| 17. | 85701 | 25.9% | 34.8%(-8.90)#193 | 37.3%(-11.4)#18,983 |
| 18. | 85756 | 25.5% | 34.8%(-9.30)#195 | 37.3%(-11.8)#19,320 |
| 19. | 85746 | 25.3% | 34.8%(-9.50)#198 | 37.3%(-12.0)#19,470 |
| 20. | 85730 | 24.6% | 34.8%(-10.2)#207 | 37.3%(-12.7)#20,091 |
| 21. | 85736 | 21.9% | 34.8%(-12.9)#239 | 37.3%(-15.4)#22,516 |
| 22. | 85710 | 21.2% | 34.8%(-13.6)#247 | 37.3%(-16.1)#23,063 |
| 23. | 85708 | 20.2% | 34.8%(-14.6)#257 | 37.3%(-17.1)#23,893 |
| 24. | 85711 | 19.4% | 34.8%(-15.4)#269 | 37.3%(-17.9)#24,505 |
| 25. | 85712 | 19.4% | 34.8%(-15.4)#270 | 37.3%(-17.9)#24,506 |
| 26. | 85716 | 18.1% | 34.8%(-16.7)#284 | 37.3%(-19.2)#25,466 |
| 27. | 85713 | 16.1% | 34.8%(-18.7)#294 | 37.3%(-21.2)#26,845 |
| 28. | 85714 | 13.9% | 34.8%(-20.9)#316 | 37.3%(-23.4)#28,150 |
| 29. | 85706 | 13.5% | 34.8%(-21.3)#319 | 37.3%(-23.8)#28,340 |
| 30. | 85719 | 13.1% | 34.8%(-21.7)#324 | 37.3%(-24.2)#28,531 |
| 31. | 85705 | 8.0% | 34.8%(-26.8)#360 | 37.3%(-29.3)#30,433 |
1
Common Questions
What are the Top 10 Zip Codes with the Highest Percentage of Households with Income Above $100,000 in Tucson, AZ?
Top 10 Zip Codes with the Highest Percentage of Households with Income Above $100,000 in Tucson, AZ are:
What zip code has the Highest Percentage of Households with Income Above $100,000 in Tucson, AZ?
85755 has the Highest Percentage of Households with Income Above $100,000 in Tucson, AZ with 54.8%.
What is the Percentage of Households with Income Above $100,000 in Tucson, AZ?
Percentage of Households with Income Above $100,000 in Tucson is 20.8%.
What is the Percentage of Households with Income Above $100,000 in Arizona?
Percentage of Households with Income Above $100,000 in Arizona is 34.8%.
What is the Percentage of Households with Income Above $100,000 in the United States?
Percentage of Households with Income Above $100,000 in the United States is 37.3%.