Zip Codes with the Highest Percentage of Scotch-Irish Population in Tucson, AZ

RELATED REPORTS & OPTIONS

Scotch-Irish
Population
Families and Households
Female Fertility
Female Fertility (Unmarried)
Race (Community Size)
Race (Percentage)
Ancestry (Community Size)
AfghanAfricanAlaska NativeAlbanianAleutAlsatianAmericanApacheArabArgentineanArmenianAssyrian / Chaldean / SyriacAustralianAustrianBasqueBelgianBelizeanBhutaneseBlackfeetBolivianBrazilianBritishBulgarianBurmeseCajunCanadianCarpatho RusynCelticCentral AmericanCentral American IndianCherokeeCheyenneChickasawChileanChineseChippewaChoctawColombianComancheCosta RicanCreeCreekCroatianCubanCzechCzechoslovakianDanishDelawareDominicanDutchDutch West IndianEastern EuropeanEcuadorianEgyptianEnglishEstonianEthiopianEuropeanFilipinoFinnishFrenchFrench American IndianFrench CanadianGermanGerman RussianGhanaianGreekGuamanian / ChamorroGuatemalanGuyaneseHaitianHonduranHopiHungarianIcelanderIndian (Asian)IndonesianInupiatIranianIraqiIrishIroquoisIsraeliItalianJamaicanJapaneseJordanianKenyanKiowaKoreanLaotianLatvianLebaneseLithuanianLumbeeLuxembourgerMacedonianMalaysianMalteseMenomineeMexicanMexican American IndianMongolianMoroccanNative HawaiianNavajoNew ZealanderNicaraguanNigerianNorthern EuropeanNorwegianOsageOttawaPaiutePakistaniPalestinianPanamanianParaguayanPennsylvania GermanPeruvianPimaPolishPortuguesePotawatomiPuebloPuerto RicanPuget Sound SalishRomanianRussianSalvadoranSamoanScandinavianScotch-IrishScottishSeminoleSerbianShoshoneSiouxSlavicSlovakSloveneSomaliSouth AfricanSouth AmericanSouth American IndianSoviet UnionSpaniardSpanishSpanish AmericanSpanish American IndianSri LankanSubsaharan AfricanSudaneseSwedishSwissSyrianThaiTlingit-HaidaTohono O'OdhamTrinidadian and TobagonianTurkishU.S. Virgin IslanderUgandanUkrainianUteVenezuelanVietnameseWelshWest IndianYaquiYugoslavianYumanYup'ikZimbabwean
Ancestry (Percentage)
AfghanAfricanAlaska NativeAlbanianAleutAlsatianAmericanApacheArabArgentineanArmenianAssyrian / Chaldean / SyriacAustralianAustrianBasqueBelgianBelizeanBhutaneseBlackfeetBolivianBrazilianBritishBulgarianBurmeseCajunCanadianCarpatho RusynCelticCentral AmericanCentral American IndianCherokeeCheyenneChickasawChileanChineseChippewaChoctawColombianComancheCosta RicanCreeCreekCroatianCubanCzechCzechoslovakianDanishDelawareDominicanDutchDutch West IndianEastern EuropeanEcuadorianEgyptianEnglishEstonianEthiopianEuropeanFilipinoFinnishFrenchFrench American IndianFrench CanadianGermanGerman RussianGhanaianGreekGuamanian / ChamorroGuatemalanGuyaneseHaitianHonduranHopiHungarianIcelanderIndian (Asian)IndonesianInupiatIranianIraqiIrishIroquoisIsraeliItalianJamaicanJapaneseJordanianKenyanKiowaKoreanLaotianLatvianLebaneseLithuanianLumbeeLuxembourgerMacedonianMalaysianMalteseMenomineeMexicanMexican American IndianMongolianMoroccanNative HawaiianNavajoNew ZealanderNicaraguanNigerianNorthern EuropeanNorwegianOsageOttawaPaiutePakistaniPalestinianPanamanianParaguayanPennsylvania GermanPeruvianPimaPolishPortuguesePotawatomiPuebloPuerto RicanPuget Sound SalishRomanianRussianSalvadoranSamoanScandinavianScotch-IrishScottishSeminoleSerbianShoshoneSiouxSlavicSlovakSloveneSomaliSouth AfricanSouth AmericanSouth American IndianSoviet UnionSpaniardSpanishSpanish AmericanSpanish American IndianSri LankanSubsaharan AfricanSudaneseSwedishSwissSyrianThaiTlingit-HaidaTohono O'OdhamTrinidadian and TobagonianTurkishU.S. Virgin IslanderUgandanUkrainianUteVenezuelanVietnameseWelshWest IndianYaquiYugoslavianYumanYup'ikZimbabwean
Immigrant Origin (Total)
AfghanistanAfricaArgentinaArmeniaAsiaAustraliaAustriaBangladeshBelarusBelgiumBoliviaBosnia and HerzegovinaBrazilBulgariaBurma / MyanmarCameroonCanadaCaribbeanCentral AmericaChileChinaColombiaCongoCosta RicaCroatiaCubaCzechoslovakiaDenmarkDominican RepublicEastern AfricaEastern AsiaEastern EuropeEcuadorEgyptEl SalvadorEnglandEthiopiaEuropeFranceGermanyGhanaGreeceGrenadaGuatemalaGuyanaHaitiHondurasHong KongHungaryIndiaIndonesiaIranIraqIrelandIsraelItalyJamaicaJapanJordanKazakhstanKenyaKoreaKuwaitLaosLatin AmericaLebanonLiberiaLithuaniaMalaysiaMexicoMicronesiaMiddle AfricaMoldovaMoroccoNepalNetherlandsNicaraguaNigeriaNorth MacedoniaNorthern AfricaNorthern EuropeNorwayOceaniaPakistanPanamaPeruPhilippinesPolandPortugalRomaniaRussiaSaudi ArabiaScotlandSerbiaSingaporeSomaliaSouth AfricaSouth AmericaSouth Central AsiaSouth Eastern AsiaSouthern EuropeSpainSri LankaSudanSwedenSwitzerlandSyriaTaiwanThailandTrinidad and TobagoTurkeyUgandaUkraineUzbekistanVenezuelaVietnamWestern AfricaWestern AsiaWestern EuropeZaireZimbabwe
Immigrant Origin (Percentage)
AfghanistanAfricaArgentinaArmeniaAsiaAustraliaAustriaBangladeshBelarusBelgiumBoliviaBosnia and HerzegovinaBrazilBulgariaBurma / MyanmarCameroonCanadaCaribbeanCentral AmericaChileChinaColombiaCongoCosta RicaCroatiaCubaCzechoslovakiaDenmarkDominican RepublicEastern AfricaEastern AsiaEastern EuropeEcuadorEgyptEl SalvadorEnglandEthiopiaEuropeFranceGermanyGhanaGreeceGrenadaGuatemalaGuyanaHaitiHondurasHong KongHungaryIndiaIndonesiaIranIraqIrelandIsraelItalyJamaicaJapanJordanKazakhstanKenyaKoreaKuwaitLaosLatin AmericaLebanonLiberiaLithuaniaMalaysiaMexicoMicronesiaMiddle AfricaMoldovaMoroccoNepalNetherlandsNicaraguaNigeriaNorth MacedoniaNorthern AfricaNorthern EuropeNorwayOceaniaPakistanPanamaPeruPhilippinesPolandPortugalRomaniaRussiaSaudi ArabiaScotlandSerbiaSingaporeSomaliaSouth AfricaSouth AmericaSouth Central AsiaSouth Eastern AsiaSouthern EuropeSpainSri LankaSudanSwedenSwitzerlandSyriaTaiwanThailandTrinidad and TobagoTurkeyUgandaUkraineUzbekistanVenezuelaVietnamWestern AfricaWestern AsiaWestern EuropeZaireZimbabwe
Income
Income (Families)
Income (Households)
Poverty
Poverty (Families)
Unemployment
Employment Occupations
Employment Industries
Employer Class
Commute Time
Commute Means
School Enrollment
Education by Degree Field
Occupancy
Finances
Physical Characteristics
Tucson
Compare Zip Codes
Comparison Subject

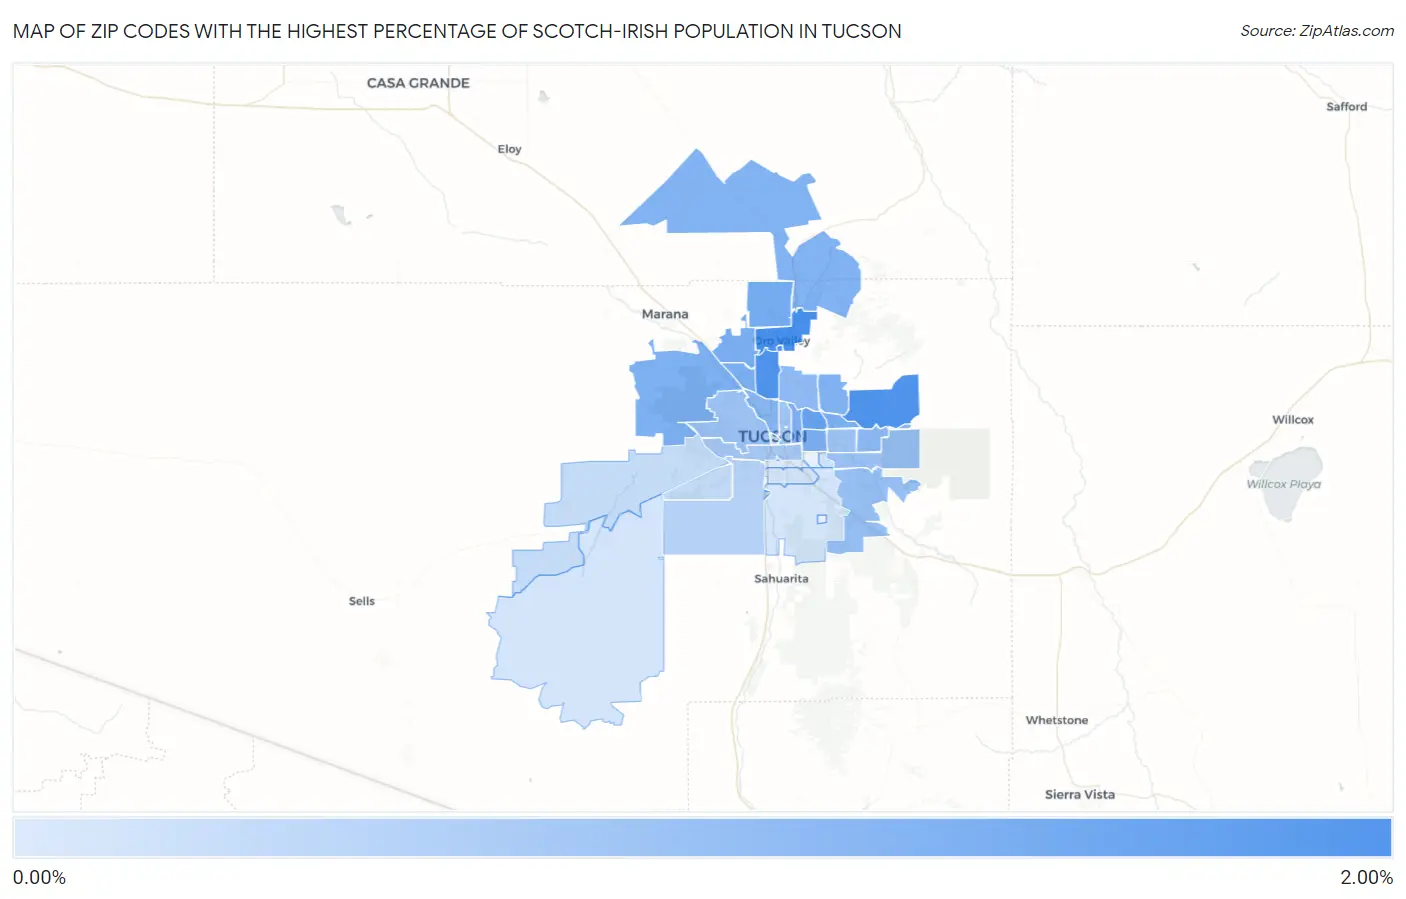
Map of Zip Codes with the Highest Percentage of Scotch-Irish Population in Tucson

0.00%
2.00%
Zip Codes with the Highest Percentage of Scotch-Irish Population in Tucson Map

Zip Codes with the Highest Percentage of Scotch-Irish Population in Tucson, AZ

Zip Code Scotch-Irish vs State vs National
1.857371.70%0.73%(+0.969)#510.82%(+0.878)#4,931
2.857491.61%0.73%(+0.882)#540.82%(+0.791)#5,322
3.857041.60%0.73%(+0.875)#560.82%(+0.784)#5,359
4.857121.38%0.73%(+0.649)#700.82%(+0.557)#6,677
5.857551.21%0.73%(+0.487)#820.82%(+0.395)#7,837
6.857421.16%0.73%(+0.429)#930.82%(+0.338)#8,271
7.857411.14%0.73%(+0.409)#970.82%(+0.317)#8,446
8.857111.13%0.73%(+0.399)#980.82%(+0.307)#8,539
9.857151.10%0.73%(+0.375)#1000.82%(+0.283)#8,733
10.857161.10%0.73%(+0.369)#1010.82%(+0.277)#8,779
11.857431.09%0.73%(+0.368)#1020.82%(+0.276)#8,792
12.857391.09%0.73%(+0.362)#1030.82%(+0.271)#8,840
13.857501.07%0.73%(+0.345)#1050.82%(+0.254)#9,017
14.857051.02%0.73%(+0.292)#1130.82%(+0.201)#9,548
15.857480.98%0.73%(+0.252)#1160.82%(+0.160)#9,981
16.857180.93%0.73%(+0.205)#1190.82%(+0.113)#10,480
17.857470.84%0.73%(+0.118)#1400.82%(+0.027)#11,481
18.857300.79%0.73%(+0.064)#1490.82%(-0.027)#12,200
19.857450.79%0.73%(+0.063)#1500.82%(-0.028)#12,206
20.857100.78%0.73%(+0.053)#1510.82%(-0.038)#12,321
21.857190.70%0.73%(-0.023)#1670.82%(-0.115)#13,370
22.857130.69%0.73%(-0.041)#1740.82%(-0.132)#13,604
23.857460.53%0.73%(-0.194)#2080.82%(-0.286)#15,893
24.857570.37%0.73%(-0.360)#2430.82%(-0.452)#18,618
25.857010.37%0.73%(-0.361)#2440.82%(-0.453)#18,636
26.857350.35%0.73%(-0.381)#2520.82%(-0.472)#18,975
27.857080.23%0.73%(-0.499)#2640.82%(-0.591)#20,959
28.857060.23%0.73%(-0.500)#2650.82%(-0.592)#20,972
29.857560.21%0.73%(-0.517)#2670.82%(-0.609)#21,299
30.857360.21%0.73%(-0.519)#2680.82%(-0.610)#21,329
31.857140.11%0.73%(-0.619)#2830.82%(-0.711)#22,960

Common Questions

What are the Top 10 Zip Codes with the Highest Percentage of Scotch-Irish Population in Tucson, AZ?
Top 10 Zip Codes with the Highest Percentage of Scotch-Irish Population in Tucson, AZ are:
#1
1.70%
#2
1.61%
#3
1.60%
#4
1.38%
#5
1.21%
#6
1.16%
#7
1.14%
#8
1.13%
#9
1.10%
#10
1.10%
What zip code has the Highest Percentage of Scotch-Irish Population in Tucson, AZ?
85737 has the Highest Percentage of Scotch-Irish Population in Tucson, AZ with 1.70%.
What is the Percentage of Scotch-Irish Population in Tucson, AZ?
Percentage of Scotch-Irish Population in Tucson is 0.78%.
What is the Percentage of Scotch-Irish Population in Arizona?
Percentage of Scotch-Irish Population in Arizona is 0.73%.
What is the Percentage of Scotch-Irish Population in the United States?
Percentage of Scotch-Irish Population in the United States is 0.82%.