Zip Codes with the Highest Percentage of Population Employed in Architecture & Engineering in Tucson, AZ
RELATED REPORTS & OPTIONS
Architecture & Engineering
Tucson
Compare Zip Codes
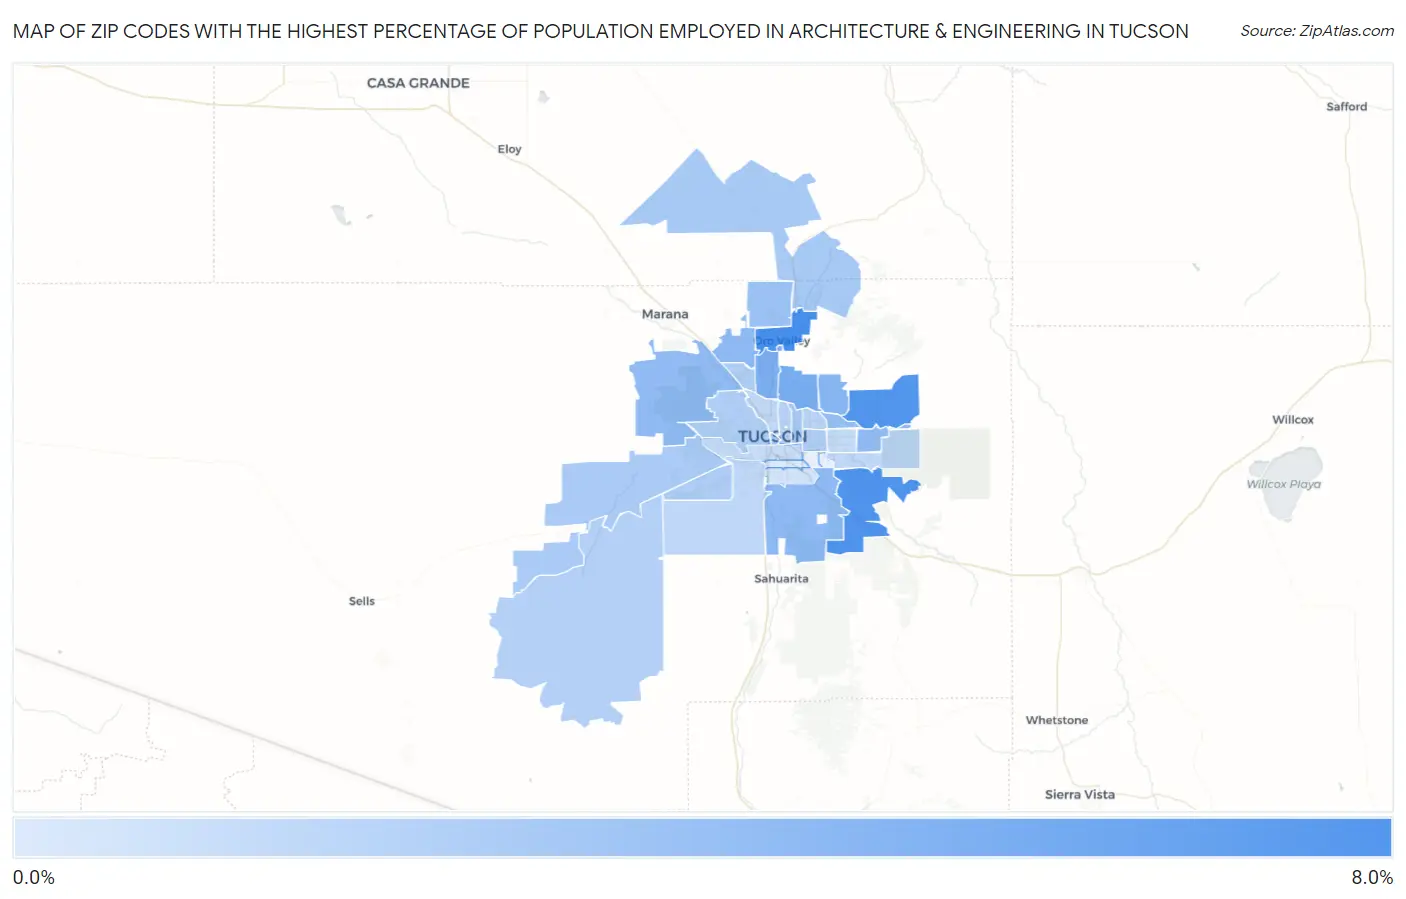
Map of Zip Codes with the Highest Percentage of Population Employed in Architecture & Engineering in Tucson
0.40%
7.6%
Zip Codes with the Highest Percentage of Population Employed in Architecture & Engineering in Tucson, AZ
| Zip Code | % Employed | vs State | vs National | |
| 1. | 85737 | 7.6% | 2.4%(+5.19)#8 | 2.1%(+5.43)#643 |
| 2. | 85747 | 7.2% | 2.4%(+4.76)#11 | 2.1%(+5.01)#713 |
| 3. | 85749 | 7.0% | 2.4%(+4.57)#12 | 2.1%(+4.81)#759 |
| 4. | 85718 | 5.3% | 2.4%(+2.87)#22 | 2.1%(+3.11)#1,481 |
| 5. | 85704 | 5.0% | 2.4%(+2.61)#27 | 2.1%(+2.85)#1,655 |
| 6. | 85750 | 4.4% | 2.4%(+2.05)#35 | 2.1%(+2.29)#2,207 |
| 7. | 85742 | 4.1% | 2.4%(+1.74)#41 | 2.1%(+1.99)#2,575 |
| 8. | 85756 | 4.1% | 2.4%(+1.73)#42 | 2.1%(+1.97)#2,592 |
| 9. | 85748 | 4.0% | 2.4%(+1.61)#44 | 2.1%(+1.85)#2,754 |
| 10. | 85743 | 4.0% | 2.4%(+1.58)#45 | 2.1%(+1.82)#2,822 |
| 11. | 85715 | 3.8% | 2.4%(+1.37)#49 | 2.1%(+1.61)#3,175 |
| 12. | 85755 | 3.6% | 2.4%(+1.17)#59 | 2.1%(+1.41)#3,591 |
| 13. | 85701 | 3.0% | 2.4%(+0.628)#75 | 2.1%(+0.870)#4,987 |
| 14. | 85716 | 2.9% | 2.4%(+0.550)#80 | 2.1%(+0.793)#5,268 |
| 15. | 85739 | 2.8% | 2.4%(+0.440)#83 | 2.1%(+0.682)#5,656 |
| 16. | 85735 | 2.7% | 2.4%(+0.340)#88 | 2.1%(+0.582)#6,033 |
| 17. | 85741 | 2.6% | 2.4%(+0.179)#96 | 2.1%(+0.421)#6,698 |
| 18. | 85757 | 2.5% | 2.4%(+0.116)#99 | 2.1%(+0.358)#6,958 |
| 19. | 85745 | 2.5% | 2.4%(+0.069)#105 | 2.1%(+0.311)#7,179 |
| 20. | 85711 | 2.4% | 2.4%(+0.010)#109 | 2.1%(+0.252)#7,473 |
| 21. | 85736 | 2.3% | 2.4%(-0.052)#115 | 2.1%(+0.190)#7,764 |
| 22. | 85712 | 2.1% | 2.4%(-0.253)#130 | 2.1%(-0.011)#8,813 |
| 23. | 85719 | 2.1% | 2.4%(-0.282)#132 | 2.1%(-0.040)#8,987 |
| 24. | 85746 | 1.8% | 2.4%(-0.614)#159 | 2.1%(-0.371)#10,961 |
| 25. | 85730 | 1.7% | 2.4%(-0.685)#168 | 2.1%(-0.443)#11,441 |
| 26. | 85705 | 1.7% | 2.4%(-0.711)#172 | 2.1%(-0.468)#11,625 |
| 27. | 85710 | 1.6% | 2.4%(-0.776)#184 | 2.1%(-0.534)#12,083 |
| 28. | 85713 | 1.3% | 2.4%(-1.05)#202 | 2.1%(-0.809)#14,027 |
| 29. | 85706 | 0.92% | 2.4%(-1.47)#237 | 2.1%(-1.23)#17,179 |
| 30. | 85714 | 0.40% | 2.4%(-1.99)#273 | 2.1%(-1.75)#20,926 |
1
Common Questions
What are the Top 10 Zip Codes with the Highest Percentage of Population Employed in Architecture & Engineering in Tucson, AZ?
Top 10 Zip Codes with the Highest Percentage of Population Employed in Architecture & Engineering in Tucson, AZ are:
What zip code has the Highest Percentage of Population Employed in Architecture & Engineering in Tucson, AZ?
85737 has the Highest Percentage of Population Employed in Architecture & Engineering in Tucson, AZ with 7.6%.
What is the Percentage of Population Employed in Architecture & Engineering in Tucson, AZ?
Percentage of Population Employed in Architecture & Engineering in Tucson is 2.4%.
What is the Percentage of Population Employed in Architecture & Engineering in Arizona?
Percentage of Population Employed in Architecture & Engineering in Arizona is 2.4%.
What is the Percentage of Population Employed in Architecture & Engineering in the United States?
Percentage of Population Employed in Architecture & Engineering in the United States is 2.1%.