Zip Codes with the Highest Percentage of Population Employed in Accommodation & Food Services in Tucson, AZ
RELATED REPORTS & OPTIONS
Accommodation & Food Services
Tucson
Compare Zip Codes
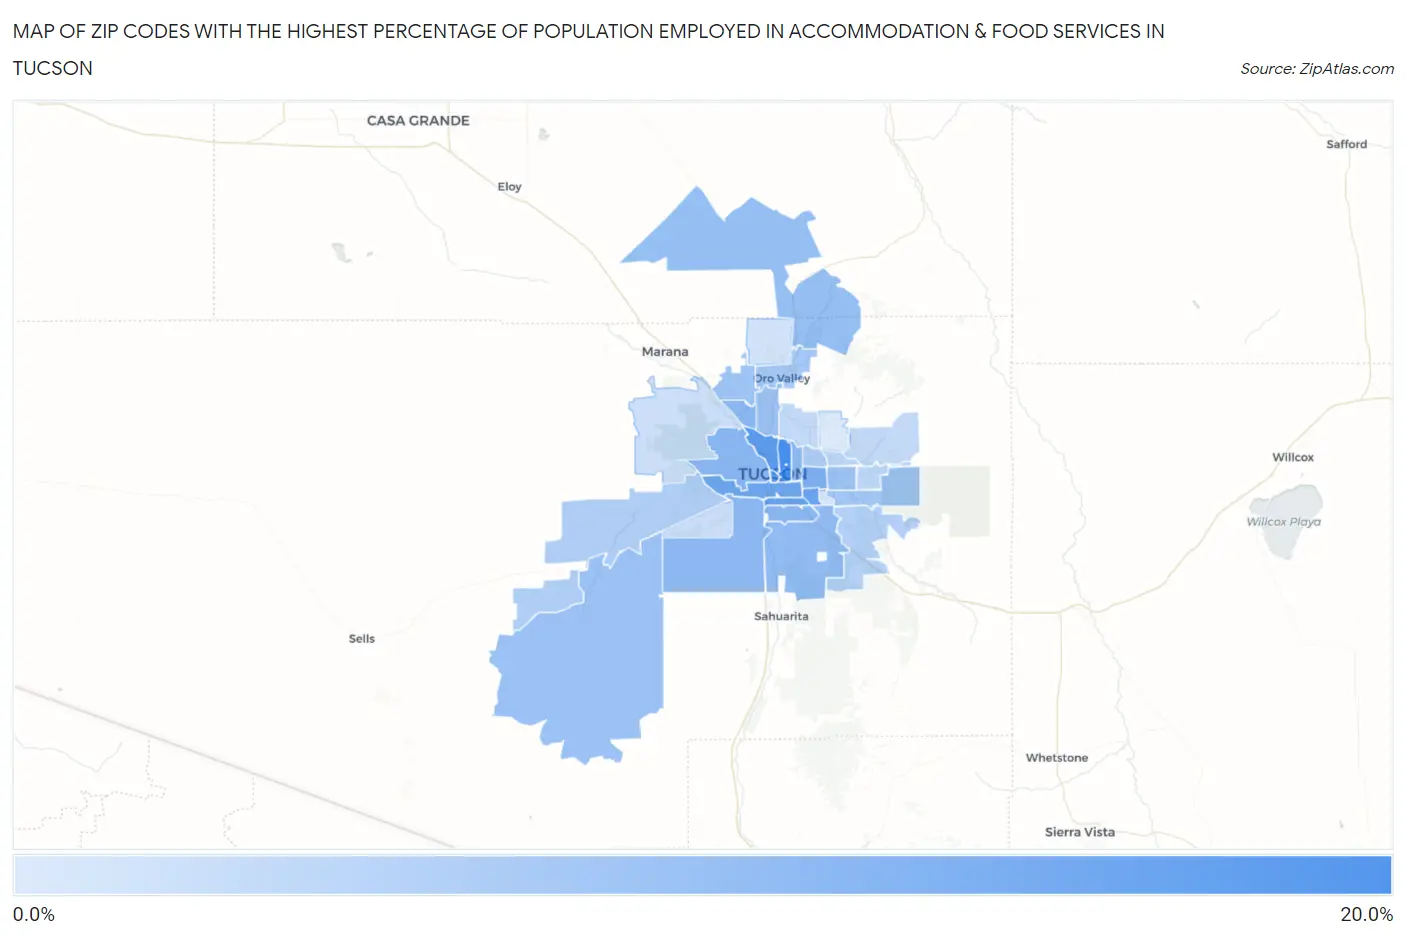
Map of Zip Codes with the Highest Percentage of Population Employed in Accommodation & Food Services in Tucson
2.7%
15.0%
Zip Codes with the Highest Percentage of Population Employed in Accommodation & Food Services in Tucson, AZ
| Zip Code | % Employed | vs State | vs National | |
| 1. | 85719 | 15.0% | 7.6%(+7.47)#46 | 6.9%(+8.15)#1,664 |
| 2. | 85701 | 13.3% | 7.6%(+5.76)#57 | 6.9%(+6.44)#2,220 |
| 3. | 85705 | 13.2% | 7.6%(+5.62)#60 | 6.9%(+6.29)#2,279 |
| 4. | 85714 | 12.2% | 7.6%(+4.66)#69 | 6.9%(+5.33)#2,704 |
| 5. | 85707 | 12.2% | 7.6%(+4.64)#70 | 6.9%(+5.31)#2,716 |
| 6. | 85713 | 11.7% | 7.6%(+4.12)#77 | 6.9%(+4.80)#3,032 |
| 7. | 85711 | 10.4% | 7.6%(+2.88)#96 | 6.9%(+3.55)#4,066 |
| 8. | 85745 | 9.4% | 7.6%(+1.85)#120 | 6.9%(+2.52)#5,339 |
| 9. | 85716 | 9.4% | 7.6%(+1.84)#122 | 6.9%(+2.52)#5,360 |
| 10. | 85706 | 9.4% | 7.6%(+1.82)#124 | 6.9%(+2.50)#5,383 |
| 11. | 85741 | 9.3% | 7.6%(+1.75)#126 | 6.9%(+2.42)#5,495 |
| 12. | 85746 | 9.2% | 7.6%(+1.64)#128 | 6.9%(+2.32)#5,657 |
| 13. | 85756 | 8.8% | 7.6%(+1.22)#136 | 6.9%(+1.89)#6,337 |
| 14. | 85739 | 8.4% | 7.6%(+0.798)#150 | 6.9%(+1.47)#7,090 |
| 15. | 85704 | 8.0% | 7.6%(+0.428)#158 | 6.9%(+1.10)#7,854 |
| 16. | 85710 | 7.9% | 7.6%(+0.359)#162 | 6.9%(+1.03)#7,998 |
| 17. | 85736 | 7.9% | 7.6%(+0.299)#165 | 6.9%(+0.972)#8,146 |
| 18. | 85742 | 7.7% | 7.6%(+0.100)#168 | 6.9%(+0.773)#8,613 |
| 19. | 85730 | 7.4% | 7.6%(-0.203)#180 | 6.9%(+0.471)#9,377 |
| 20. | 85737 | 7.1% | 7.6%(-0.471)#188 | 6.9%(+0.203)#10,089 |
| 21. | 85712 | 6.6% | 7.6%(-0.961)#209 | 6.9%(-0.288)#11,542 |
| 22. | 85735 | 6.3% | 7.6%(-1.23)#219 | 6.9%(-0.553)#12,384 |
| 23. | 85747 | 6.0% | 7.6%(-1.52)#237 | 6.9%(-0.849)#13,351 |
| 24. | 85748 | 5.3% | 7.6%(-2.29)#274 | 6.9%(-1.61)#15,877 |
| 25. | 85715 | 5.2% | 7.6%(-2.35)#276 | 6.9%(-1.67)#16,078 |
| 26. | 85718 | 4.8% | 7.6%(-2.73)#290 | 6.9%(-2.06)#17,420 |
| 27. | 85749 | 4.7% | 7.6%(-2.85)#293 | 6.9%(-2.18)#17,803 |
| 28. | 85757 | 4.1% | 7.6%(-3.42)#309 | 6.9%(-2.75)#19,705 |
| 29. | 85743 | 4.0% | 7.6%(-3.57)#313 | 6.9%(-2.89)#20,194 |
| 30. | 85755 | 3.6% | 7.6%(-3.98)#327 | 6.9%(-3.30)#21,534 |
| 31. | 85708 | 3.3% | 7.6%(-4.23)#333 | 6.9%(-3.56)#22,322 |
| 32. | 85750 | 2.7% | 7.6%(-4.83)#344 | 6.9%(-4.15)#23,940 |
1
Common Questions
What are the Top 10 Zip Codes with the Highest Percentage of Population Employed in Accommodation & Food Services in Tucson, AZ?
Top 10 Zip Codes with the Highest Percentage of Population Employed in Accommodation & Food Services in Tucson, AZ are:
What zip code has the Highest Percentage of Population Employed in Accommodation & Food Services in Tucson, AZ?
85719 has the Highest Percentage of Population Employed in Accommodation & Food Services in Tucson, AZ with 15.0%.
What is the Percentage of Population Employed in Accommodation & Food Services in Tucson, AZ?
Percentage of Population Employed in Accommodation & Food Services in Tucson is 9.8%.
What is the Percentage of Population Employed in Accommodation & Food Services in Arizona?
Percentage of Population Employed in Accommodation & Food Services in Arizona is 7.6%.
What is the Percentage of Population Employed in Accommodation & Food Services in the United States?
Percentage of Population Employed in Accommodation & Food Services in the United States is 6.9%.