Zip Codes with the Highest Percentage of Population Employed in Architecture & Engineering in Prescott, AZ
RELATED REPORTS & OPTIONS
Architecture & Engineering
Prescott
Compare Zip Codes
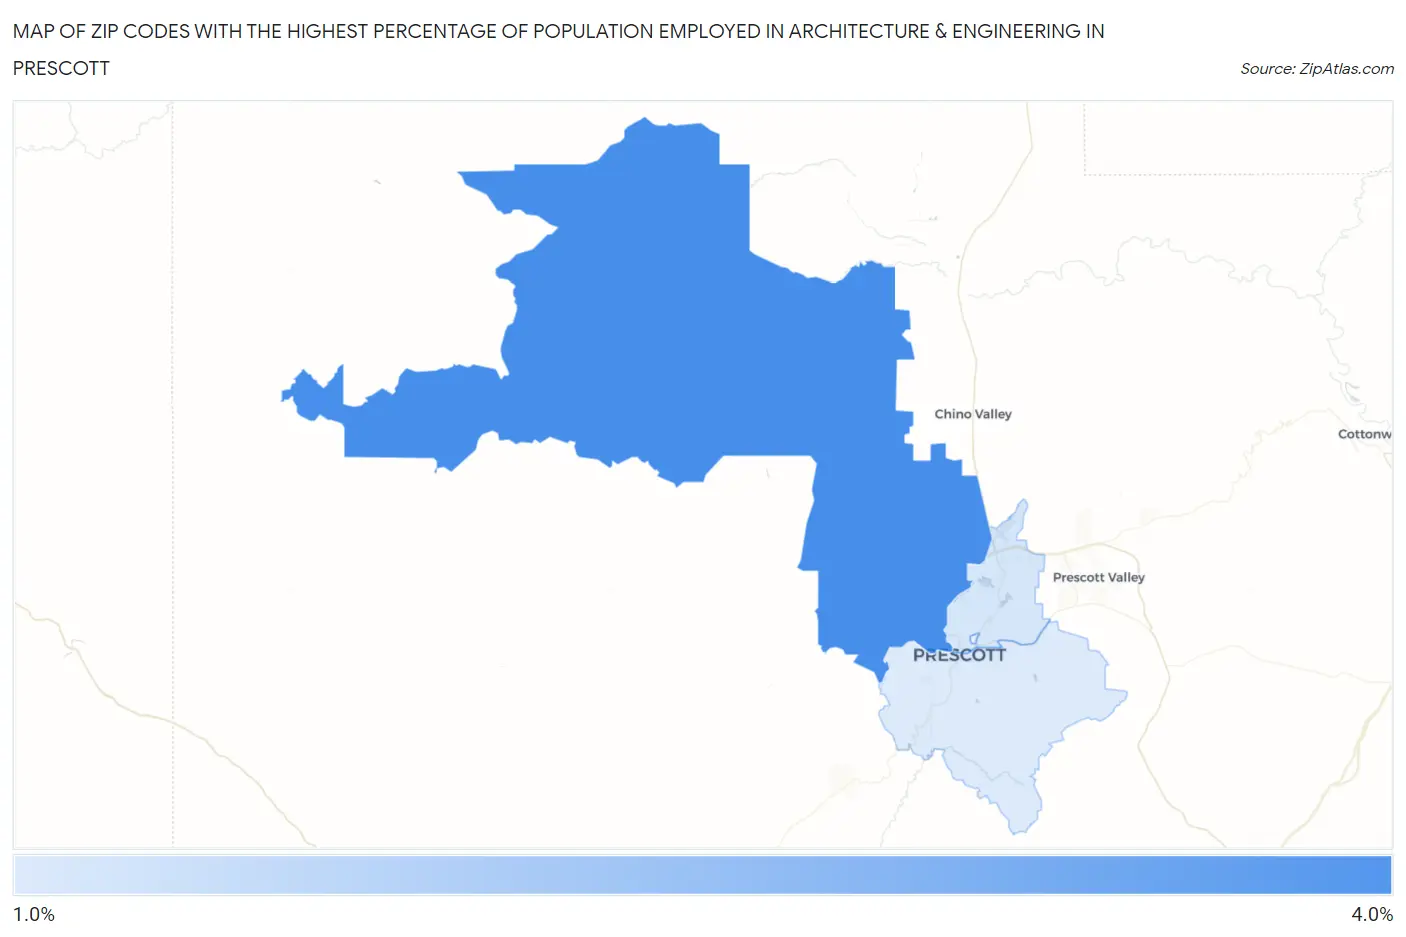
Map of Zip Codes with the Highest Percentage of Population Employed in Architecture & Engineering in Prescott
1.7%
3.0%
Zip Codes with the Highest Percentage of Population Employed in Architecture & Engineering in Prescott, AZ
| Zip Code | % Employed | vs State | vs National | |
| 1. | 86305 | 3.0% | 2.4%(+0.656)#72 | 2.1%(+0.898)#4,903 |
| 2. | 86301 | 1.8% | 2.4%(-0.629)#160 | 2.1%(-0.387)#11,053 |
| 3. | 86303 | 1.7% | 2.4%(-0.682)#167 | 2.1%(-0.439)#11,420 |
1
Common Questions
What are the Top 3 Zip Codes with the Highest Percentage of Population Employed in Architecture & Engineering in Prescott, AZ?
Top 3 Zip Codes with the Highest Percentage of Population Employed in Architecture & Engineering in Prescott, AZ are:
What zip code has the Highest Percentage of Population Employed in Architecture & Engineering in Prescott, AZ?
86305 has the Highest Percentage of Population Employed in Architecture & Engineering in Prescott, AZ with 3.0%.
What is the Percentage of Population Employed in Architecture & Engineering in Prescott, AZ?
Percentage of Population Employed in Architecture & Engineering in Prescott is 1.7%.
What is the Percentage of Population Employed in Architecture & Engineering in Arizona?
Percentage of Population Employed in Architecture & Engineering in Arizona is 2.4%.
What is the Percentage of Population Employed in Architecture & Engineering in the United States?
Percentage of Population Employed in Architecture & Engineering in the United States is 2.1%.