Zip Codes with the Highest Percentage of Population Employed in Architecture & Engineering in Casa Grande, AZ
RELATED REPORTS & OPTIONS
Architecture & Engineering
Casa Grande
Compare Zip Codes
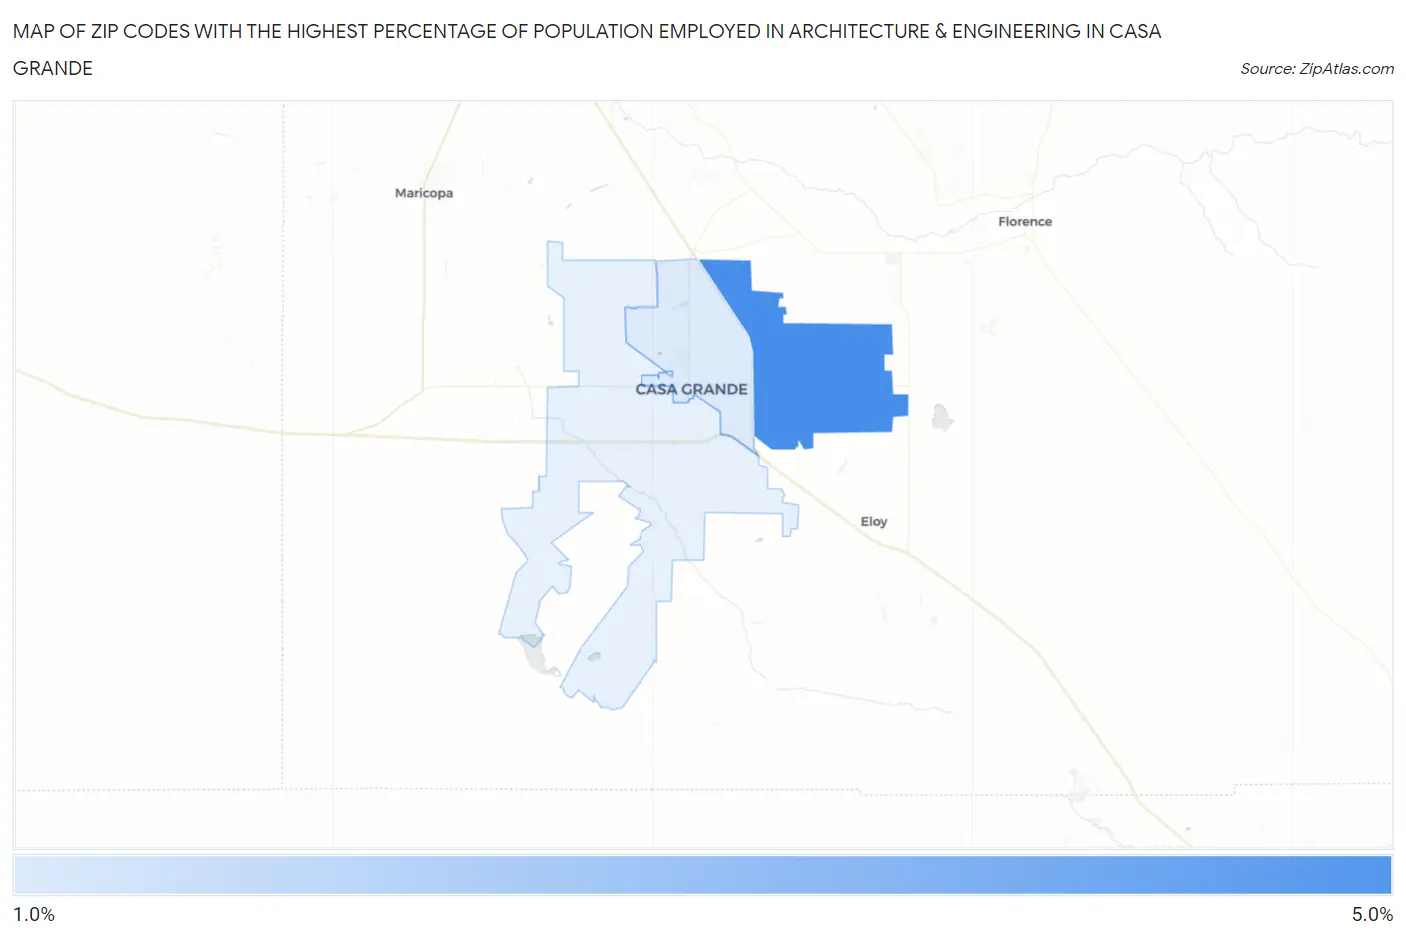
Map of Zip Codes with the Highest Percentage of Population Employed in Architecture & Engineering in Casa Grande
1.6%
4.4%
Zip Codes with the Highest Percentage of Population Employed in Architecture & Engineering in Casa Grande, AZ
| Zip Code | % Employed | vs State | vs National | |
| 1. | 85194 | 4.4% | 2.4%(+2.01)#36 | 2.1%(+2.25)#2,261 |
| 2. | 85122 | 1.6% | 2.4%(-0.814)#185 | 2.1%(-0.572)#12,325 |
1
Common Questions
What are the Top Zip Codes with the Highest Percentage of Population Employed in Architecture & Engineering in Casa Grande, AZ?
Top Zip Codes with the Highest Percentage of Population Employed in Architecture & Engineering in Casa Grande, AZ are:
What zip code has the Highest Percentage of Population Employed in Architecture & Engineering in Casa Grande, AZ?
85194 has the Highest Percentage of Population Employed in Architecture & Engineering in Casa Grande, AZ with 4.4%.
What is the Percentage of Population Employed in Architecture & Engineering in Casa Grande, AZ?
Percentage of Population Employed in Architecture & Engineering in Casa Grande is 1.8%.
What is the Percentage of Population Employed in Architecture & Engineering in Arizona?
Percentage of Population Employed in Architecture & Engineering in Arizona is 2.4%.
What is the Percentage of Population Employed in Architecture & Engineering in the United States?
Percentage of Population Employed in Architecture & Engineering in the United States is 2.1%.