Zip Codes with the Most Immigrants from Europe in Eureka Springs, AR
RELATED REPORTS & OPTIONS
Europe
Eureka Springs
Compare Zip Codes
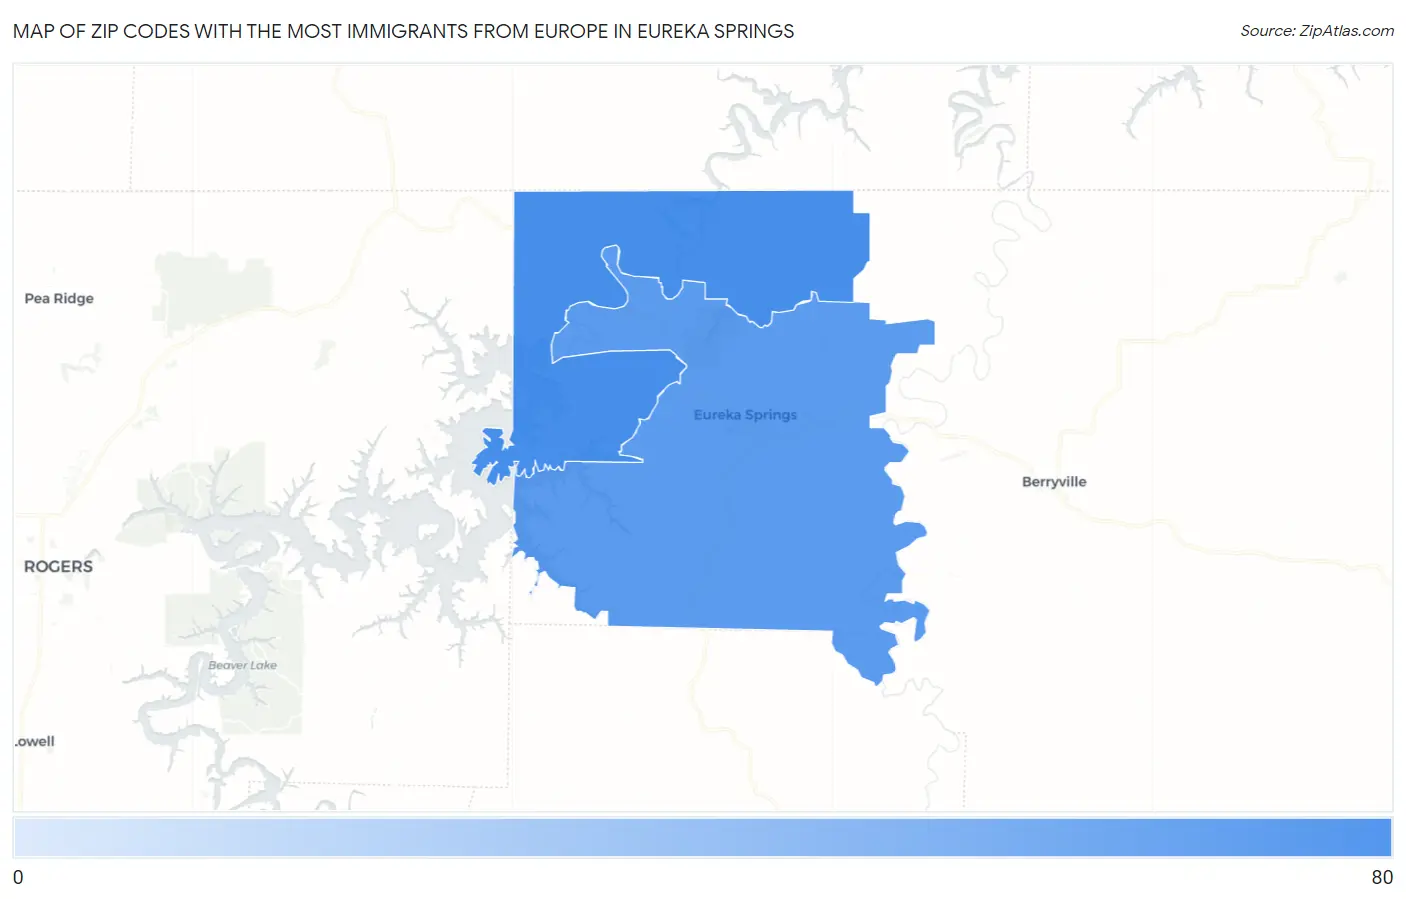
Map of Zip Codes with the Most Immigrants from Europe in Eureka Springs
36
67
Zip Codes with the Most Immigrants from Europe in Eureka Springs, AR
| Zip Code | Europe | vs State | vs National | |
| 1. | 72631 | 67 | 10,166(0.66%)#45 | 4,820,287(0.00%)#9,211 |
| 2. | 72632 | 36 | 10,166(0.35%)#72 | 4,820,287(0.00%)#11,266 |
1
Common Questions
What are the Top Zip Codes with the Most Immigrants from Europe in Eureka Springs, AR?
Top Zip Codes with the Most Immigrants from Europe in Eureka Springs, AR are:
What zip code has the Most Immigrants from Europe in Eureka Springs, AR?
72631 has the Most Immigrants from Europe in Eureka Springs, AR with 67.
What is the Total Immigrants from Europe in Eureka Springs, AR?
Total Immigrants from Europe in Eureka Springs is 5.
What is the Total Immigrants from Europe in Arkansas?
Total Immigrants from Europe in Arkansas is 10,166.
What is the Total Immigrants from Europe in the United States?
Total Immigrants from Europe in the United States is 4,820,287.