Zip Codes with the Highest Percentage of Population Employed in Food Preparation & Serving in Jonesboro, AR
RELATED REPORTS & OPTIONS
Food Preparation & Serving
Jonesboro
Compare Zip Codes
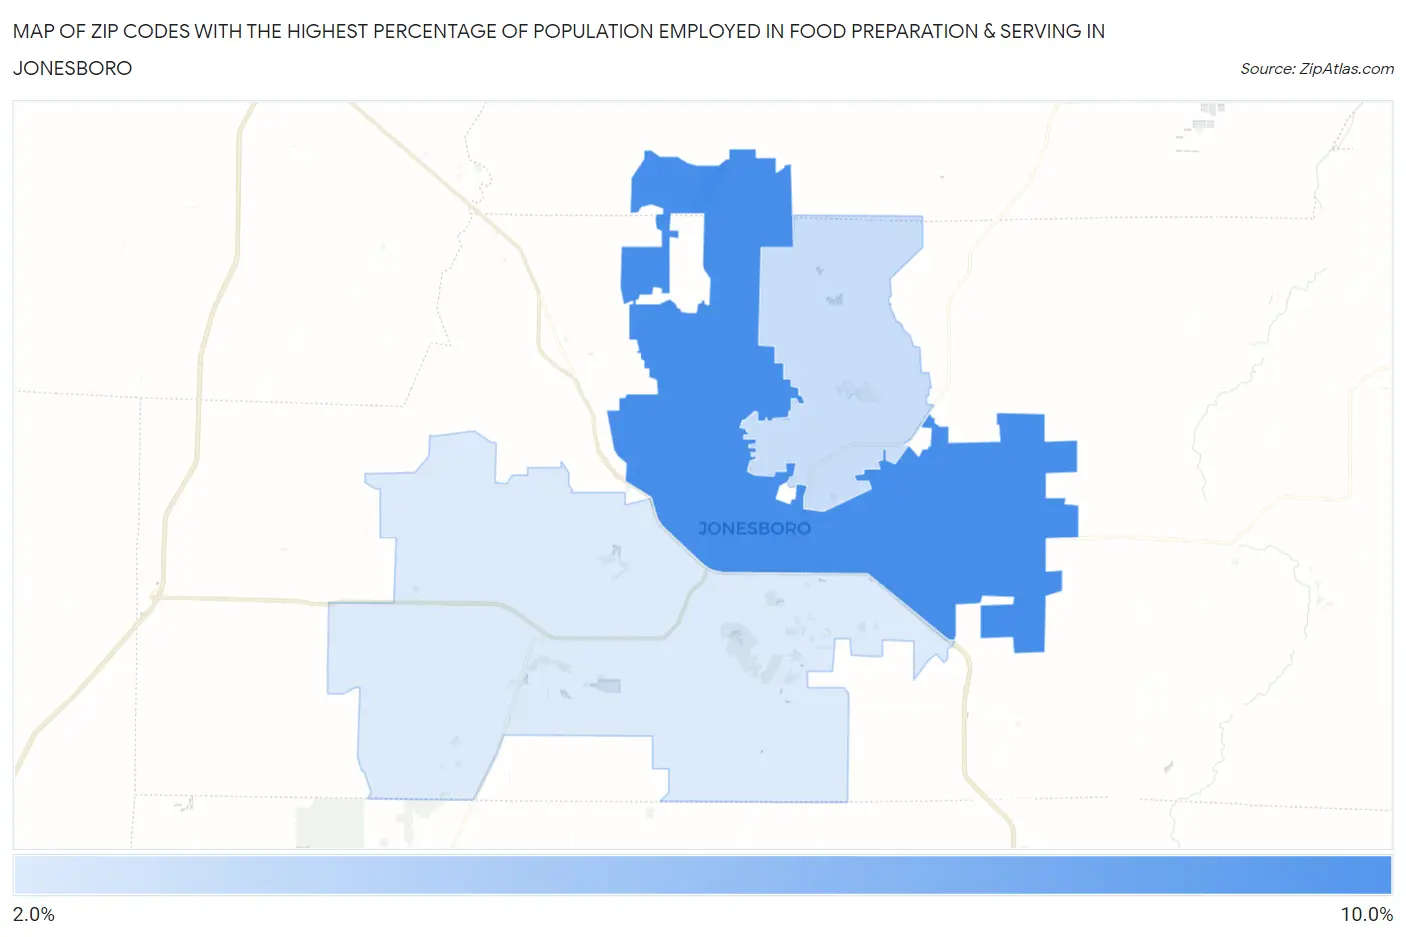
Map of Zip Codes with the Highest Percentage of Population Employed in Food Preparation & Serving in Jonesboro
2.9%
8.9%
Zip Codes with the Highest Percentage of Population Employed in Food Preparation & Serving in Jonesboro, AR
| Zip Code | % Employed | vs State | vs National | |
| 1. | 72401 | 8.9% | 5.4%(+3.55)#78 | 5.3%(+3.62)#3,611 |
| 2. | 72405 | 3.8% | 5.4%(-1.60)#280 | 5.3%(-1.53)#18,101 |
| 3. | 72404 | 2.9% | 5.4%(-2.43)#333 | 5.3%(-2.36)#21,527 |
1
Common Questions
What are the Top Zip Codes with the Highest Percentage of Population Employed in Food Preparation & Serving in Jonesboro, AR?
Top Zip Codes with the Highest Percentage of Population Employed in Food Preparation & Serving in Jonesboro, AR are:
What zip code has the Highest Percentage of Population Employed in Food Preparation & Serving in Jonesboro, AR?
72401 has the Highest Percentage of Population Employed in Food Preparation & Serving in Jonesboro, AR with 8.9%.
What is the Percentage of Population Employed in Food Preparation & Serving in Jonesboro, AR?
Percentage of Population Employed in Food Preparation & Serving in Jonesboro is 6.5%.
What is the Percentage of Population Employed in Food Preparation & Serving in Arkansas?
Percentage of Population Employed in Food Preparation & Serving in Arkansas is 5.4%.
What is the Percentage of Population Employed in Food Preparation & Serving in the United States?
Percentage of Population Employed in Food Preparation & Serving in the United States is 5.3%.