Zip Codes with the Highest Percentage of Households Residing in Condos/Apartments in Little Rock, AR

RELATED REPORTS & OPTIONS

Condo/Apartment Residency
Population
Families and Households
Female Fertility
Female Fertility (Unmarried)
Race (Community Size)
Race (Percentage)
Ancestry (Community Size)
AfricanAmericanApacheArabArgentineanArmenianAssyrian / Chaldean / SyriacAustrianBelgianBhutaneseBlackfeetBritishBurmeseCajunCanadianCelticCentral AmericanCherokeeChileanChoctawColombianCroatianCubanCzechCzechoslovakianDanishDutchEastern EuropeanEgyptianEnglishEuropeanFinnishFrenchFrench CanadianGermanGhanaianGreekGuatemalanGuyaneseHonduranHungarianIndian (Asian)InupiatIranianIrishIroquoisIsraeliItalianJamaicanKoreanLaotianLebaneseLithuanianMalaysianMexicanMexican American IndianMoroccanNative HawaiianNicaraguanNigerianNorthern EuropeanNorwegianOsagePakistaniPanamanianPolishPortuguesePuerto RicanRomanianRussianSalvadoranScandinavianScotch-IrishScottishSiouxSlavicSlovakSouth AmericanSpaniardSpanishSri LankanSubsaharan AfricanSwedishSwissSyrianThaiTrinidadian and TobagonianTurkishUkrainianVenezuelanVietnameseWelshWest IndianYugoslavian
Ancestry (Percentage)
AfricanAmericanApacheArabArgentineanArmenianAssyrian / Chaldean / SyriacAustrianBelgianBhutaneseBlackfeetBritishBurmeseCajunCanadianCelticCentral AmericanCherokeeChileanChoctawColombianCroatianCubanCzechCzechoslovakianDanishDutchEastern EuropeanEgyptianEnglishEuropeanFinnishFrenchFrench CanadianGermanGhanaianGreekGuatemalanGuyaneseHonduranHungarianIndian (Asian)InupiatIranianIrishIroquoisIsraeliItalianJamaicanKoreanLaotianLebaneseLithuanianMalaysianMexicanMexican American IndianMoroccanNative HawaiianNicaraguanNigerianNorthern EuropeanNorwegianOsagePakistaniPanamanianPolishPortuguesePuerto RicanRomanianRussianSalvadoranScandinavianScotch-IrishScottishSiouxSlavicSlovakSouth AmericanSpaniardSpanishSri LankanSubsaharan AfricanSwedishSwissSyrianThaiTrinidadian and TobagonianTurkishUkrainianVenezuelanVietnameseWelshWest IndianYugoslavian
Immigrant Origin (Total)
Immigrant Origin (Percentage)
Income
Income (Families)
Income (Households)
Poverty
Poverty (Families)
Unemployment
Employment Occupations
Employment Industries
Employer Class
Commute Time
Commute Means
School Enrollment
Education by Degree Field
Occupancy
Finances
Physical Characteristics
Little Rock
Compare Zip Codes
Comparison Subject

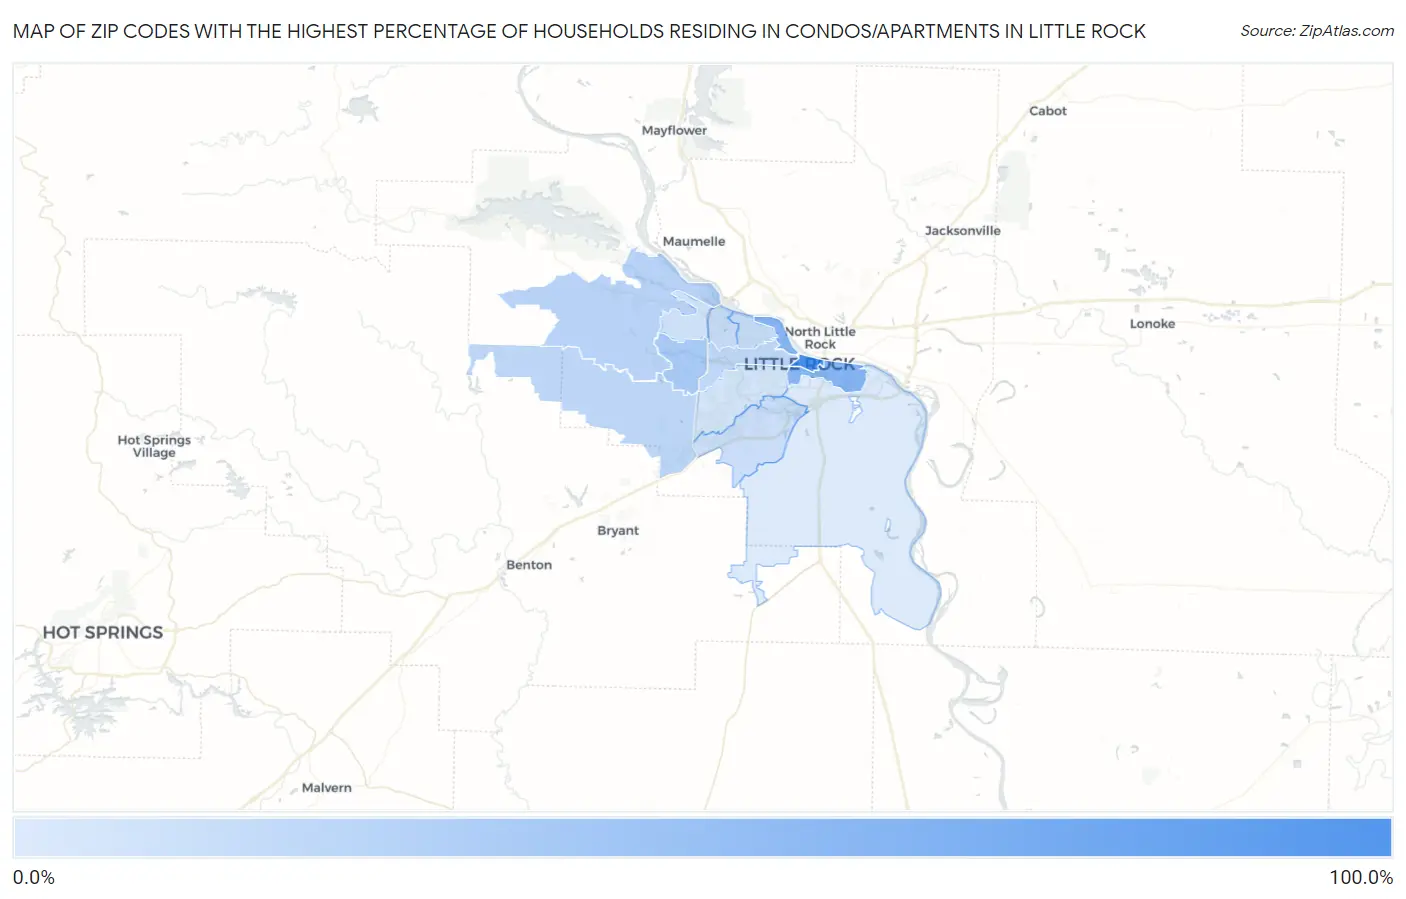
Map of Zip Codes with the Highest Percentage of Households Residing in Condos/Apartments in Little Rock

0.0%
100.0%
Zip Codes with the Highest Percentage of Households Residing in Condos/Apartments in Little Rock Map

Zip Codes with the Highest Percentage of Households Residing in Condos/Apartments in Little Rock, AR

Zip Code Detached Home Residency vs State vs National
1.7220187.7%6.7%(+81.0)#113.8%(+73.9)#173
2.7220246.8%6.7%(+40.1)#313.8%(+33.0)#645
3.7221128.1%6.7%(+21.4)#513.8%(+14.3)#1,430
4.7222320.6%6.7%(+13.9)#1113.8%(+6.80)#2,320
5.7221018.1%6.7%(+11.4)#1313.8%(+4.30)#2,815
6.7220517.1%6.7%(+10.4)#1413.8%(+3.30)#3,015
7.7220713.8%6.7%(+7.10)#1613.8%(=0.000)#3,971
8.7222712.7%6.7%(+6.00)#2013.8%(-1.10)#4,339
9.7220912.1%6.7%(+5.40)#2113.8%(-1.70)#4,567
10.7221210.3%6.7%(+3.60)#2913.8%(-3.50)#5,357
11.722048.5%6.7%(+1.80)#3813.8%(-5.30)#6,323
12.722064.2%6.7%(-2.50)#7813.8%(-9.60)#9,947

Common Questions

What are the Top 10 Zip Codes with the Highest Percentage of Households Residing in Condos/Apartments in Little Rock, AR?
Top 10 Zip Codes with the Highest Percentage of Households Residing in Condos/Apartments in Little Rock, AR are:
#1
87.7%
#2
46.8%
#3
28.1%
#4
20.6%
#5
18.1%
#6
17.1%
#7
13.8%
#8
12.7%
#9
12.1%
#10
10.3%
What zip code has the Highest Percentage of Households Residing in Condos/Apartments in Little Rock, AR?
72201 has the Highest Percentage of Households Residing in Condos/Apartments in Little Rock, AR with 87.7%.
What is the Percentage of Households Residing in Condos/Apartments in Little Rock, AR?
Percentage of Households Residing in Condos/Apartments in Little Rock is 18.5%.
What is the Percentage of Households Residing in Condos/Apartments in Arkansas?
Percentage of Households Residing in Condos/Apartments in Arkansas is 6.7%.
What is the Percentage of Households Residing in Condos/Apartments in the United States?
Percentage of Households Residing in Condos/Apartments in the United States is 13.8%.