Zip Codes with the Highest Percentage of Population Employed in Agriculture, Fishing & Hunting in Mobile, AL
RELATED REPORTS & OPTIONS
Agriculture, Fishing & Hunting
Mobile
Compare Zip Codes
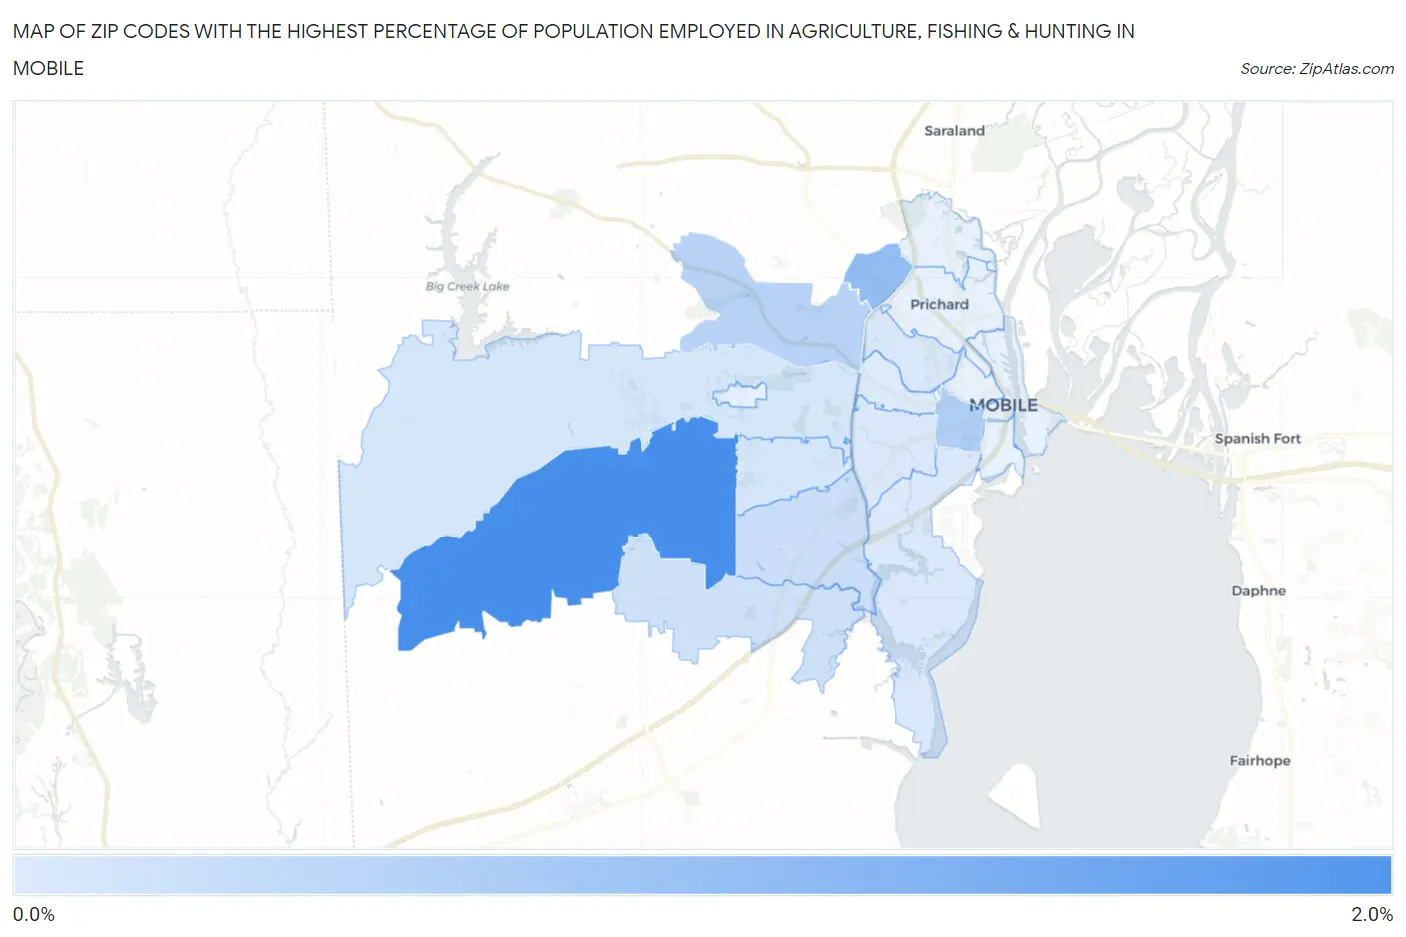
Map of Zip Codes with the Highest Percentage of Population Employed in Agriculture, Fishing & Hunting in Mobile
0.0%
2.0%
Zip Codes with the Highest Percentage of Population Employed in Agriculture, Fishing & Hunting in Mobile, AL
| Zip Code | % Employed | vs State | vs National | |
| 1. | 36695 | 1.9% | 0.96%(+0.937)#174 | 1.2%(+0.700)#13,032 |
| 2. | 36612 | 0.94% | 0.96%(-0.021)#256 | 1.2%(-0.258)#16,489 |
| 3. | 36604 | 0.59% | 0.96%(-0.372)#306 | 1.2%(-0.608)#18,544 |
| 4. | 36618 | 0.49% | 0.96%(-0.469)#326 | 1.2%(-0.706)#19,342 |
| 5. | 36693 | 0.26% | 0.96%(-0.707)#389 | 1.2%(-0.944)#21,699 |
| 6. | 36619 | 0.22% | 0.96%(-0.741)#396 | 1.2%(-0.978)#22,088 |
| 7. | 36609 | 0.13% | 0.96%(-0.829)#425 | 1.2%(-1.07)#23,231 |
| 8. | 36608 | 0.13% | 0.96%(-0.837)#426 | 1.2%(-1.07)#23,328 |
| 9. | 36617 | 0.099% | 0.96%(-0.864)#434 | 1.2%(-1.10)#23,700 |
| 10. | 36605 | 0.072% | 0.96%(-0.891)#439 | 1.2%(-1.13)#24,072 |
| 11. | 36606 | 0.055% | 0.96%(-0.907)#442 | 1.2%(-1.14)#24,280 |
| 12. | 36607 | 0.041% | 0.96%(-0.922)#445 | 1.2%(-1.16)#24,438 |
1
Common Questions
What are the Top 10 Zip Codes with the Highest Percentage of Population Employed in Agriculture, Fishing & Hunting in Mobile, AL?
Top 10 Zip Codes with the Highest Percentage of Population Employed in Agriculture, Fishing & Hunting in Mobile, AL are:
What zip code has the Highest Percentage of Population Employed in Agriculture, Fishing & Hunting in Mobile, AL?
36695 has the Highest Percentage of Population Employed in Agriculture, Fishing & Hunting in Mobile, AL with 1.9%.
What is the Percentage of Population Employed in Agriculture, Fishing & Hunting in Mobile, AL?
Percentage of Population Employed in Agriculture, Fishing & Hunting in Mobile is 0.16%.
What is the Percentage of Population Employed in Agriculture, Fishing & Hunting in Alabama?
Percentage of Population Employed in Agriculture, Fishing & Hunting in Alabama is 0.96%.
What is the Percentage of Population Employed in Agriculture, Fishing & Hunting in the United States?
Percentage of Population Employed in Agriculture, Fishing & Hunting in the United States is 1.2%.