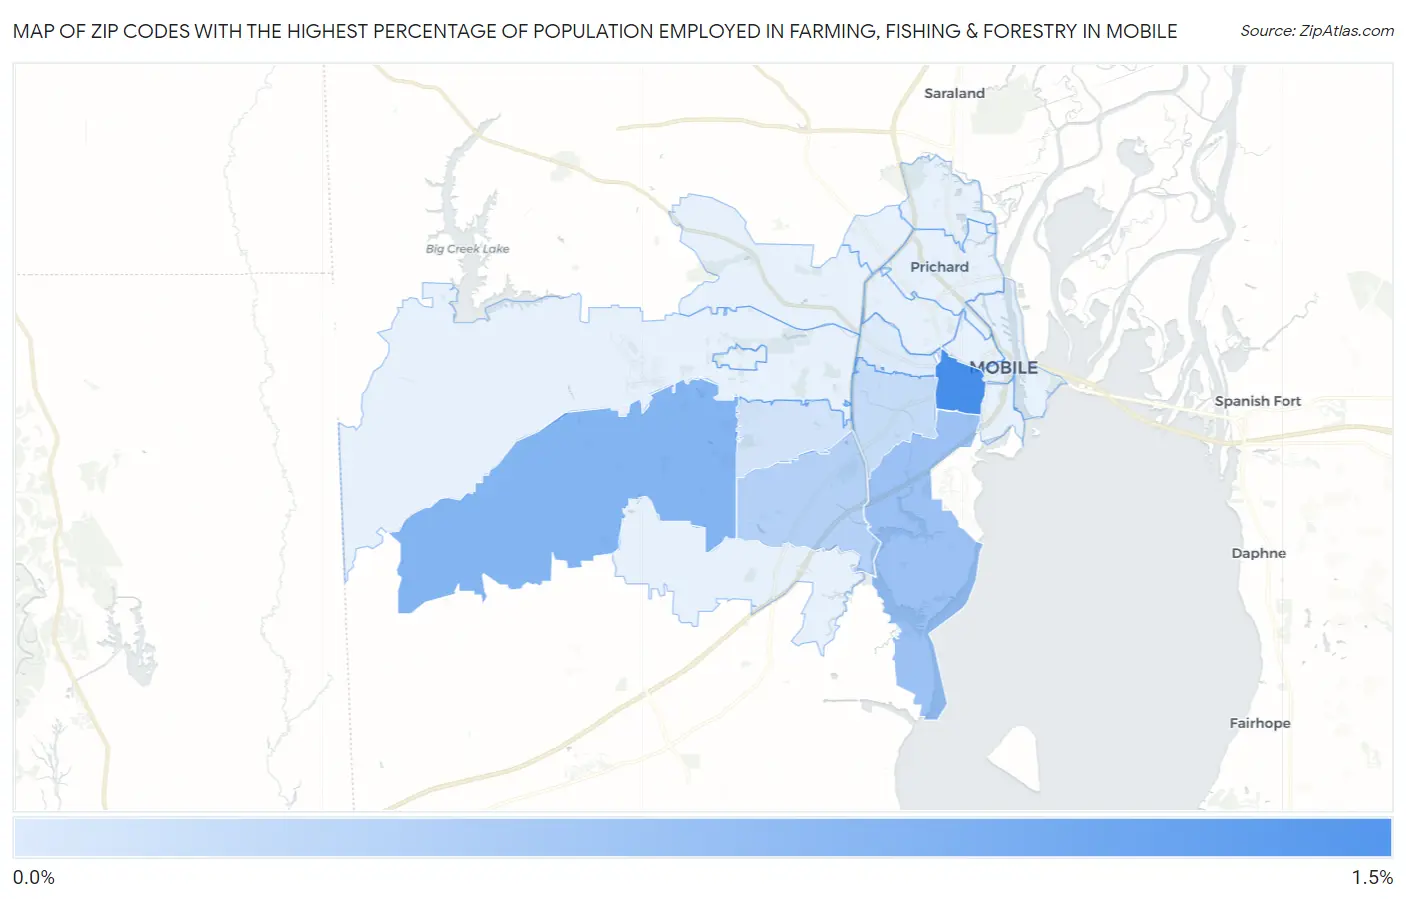
Zip Codes with the Highest Percentage of Population Employed in Farming, Fishing & Forestry in Mobile, AL
RELATED REPORTS & OPTIONS
Farming, Fishing & Forestry
Mobile
Compare Zip Codes
Map of Zip Codes with the Highest Percentage of Population Employed in Farming, Fishing & Forestry in Mobile
0.0%
1.5%
Zip Codes with the Highest Percentage of Population Employed in Farming, Fishing & Forestry in Mobile, AL
| Zip Code | % Employed | vs State | vs National | |
| 1. | 36604 | 1.4% | 0.42%(+0.939)#95 | 0.61%(+0.751)#8,353 |
| 2. | 36695 | 0.82% | 0.42%(+0.401)#148 | 0.61%(+0.213)#10,661 |
| 3. | 36605 | 0.60% | 0.42%(+0.179)#167 | 0.61%(-0.009)#12,061 |
| 4. | 36693 | 0.40% | 0.42%(-0.023)#203 | 0.61%(-0.210)#13,801 |
| 5. | 36606 | 0.23% | 0.42%(-0.185)#240 | 0.61%(-0.373)#15,647 |
| 6. | 36609 | 0.13% | 0.42%(-0.284)#280 | 0.61%(-0.471)#17,208 |
| 7. | 36607 | 0.041% | 0.42%(-0.377)#310 | 0.61%(-0.565)#18,795 |
1
Common Questions
What are the Top 10 Zip Codes with the Highest Percentage of Population Employed in Farming, Fishing & Forestry in Mobile, AL?
Top 10 Zip Codes with the Highest Percentage of Population Employed in Farming, Fishing & Forestry in Mobile, AL are:
What zip code has the Highest Percentage of Population Employed in Farming, Fishing & Forestry in Mobile, AL?
36604 has the Highest Percentage of Population Employed in Farming, Fishing & Forestry in Mobile, AL with 1.4%.
What is the Percentage of Population Employed in Farming, Fishing & Forestry in Mobile, AL?
Percentage of Population Employed in Farming, Fishing & Forestry in Mobile is 0.24%.
What is the Percentage of Population Employed in Farming, Fishing & Forestry in Alabama?
Percentage of Population Employed in Farming, Fishing & Forestry in Alabama is 0.42%.
What is the Percentage of Population Employed in Farming, Fishing & Forestry in the United States?
Percentage of Population Employed in Farming, Fishing & Forestry in the United States is 0.61%.