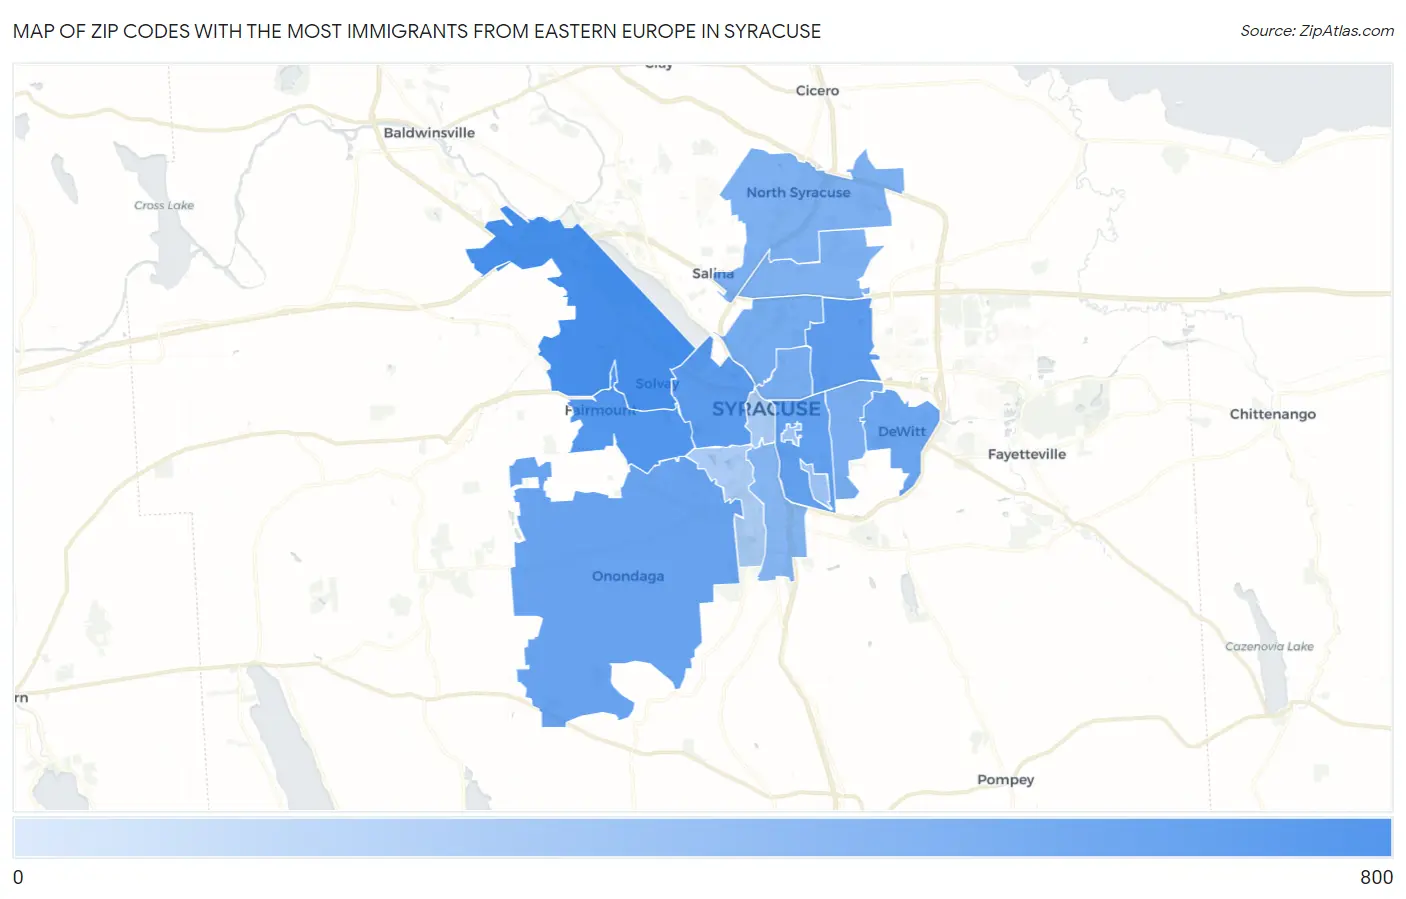
Zip Codes with the Most Immigrants from Eastern Europe in Syracuse, NY
RELATED REPORTS & OPTIONS
Eastern Europe
Syracuse
Compare Zip Codes
Map of Zip Codes with the Most Immigrants from Eastern Europe in Syracuse
8
665
Zip Codes with the Most Immigrants from Eastern Europe in Syracuse, NY
| Zip Code | Eastern Europe | vs State | vs National | |
| 1. | 13209 | 665 | 372,407(0.18%)#110 | 2,208,794(0.03%)#654 |
| 2. | 13219 | 412 | 372,407(0.11%)#170 | 2,208,794(0.02%)#1,255 |
| 3. | 13204 | 265 | 372,407(0.07%)#240 | 2,208,794(0.01%)#2,077 |
| 4. | 13206 | 232 | 372,407(0.06%)#269 | 2,208,794(0.01%)#2,347 |
| 5. | 13210 | 191 | 372,407(0.05%)#305 | 2,208,794(0.01%)#2,798 |
| 6. | 13215 | 157 | 372,407(0.04%)#344 | 2,208,794(0.01%)#3,289 |
| 7. | 13214 | 129 | 372,407(0.03%)#382 | 2,208,794(0.01%)#3,777 |
| 8. | 13208 | 92 | 372,407(0.02%)#438 | 2,208,794(0.00%)#4,667 |
| 9. | 13203 | 83 | 372,407(0.02%)#462 | 2,208,794(0.00%)#4,949 |
| 10. | 13224 | 73 | 372,407(0.02%)#495 | 2,208,794(0.00%)#5,261 |
| 11. | 13212 | 67 | 372,407(0.02%)#516 | 2,208,794(0.00%)#5,471 |
| 12. | 13211 | 61 | 372,407(0.02%)#536 | 2,208,794(0.00%)#5,732 |
| 13. | 13205 | 44 | 372,407(0.01%)#583 | 2,208,794(0.00%)#6,550 |
| 14. | 13244 | 18 | 372,407(0.00%)#744 | 2,208,794(0.00%)#8,821 |
| 15. | 13202 | 9 | 372,407(0.00%)#844 | 2,208,794(0.00%)#10,464 |
| 16. | 13207 | 8 | 372,407(0.00%)#861 | 2,208,794(0.00%)#10,631 |
1
Common Questions
What are the Top 10 Zip Codes with the Most Immigrants from Eastern Europe in Syracuse, NY?
Top 10 Zip Codes with the Most Immigrants from Eastern Europe in Syracuse, NY are:
What zip code has the Most Immigrants from Eastern Europe in Syracuse, NY?
13209 has the Most Immigrants from Eastern Europe in Syracuse, NY with 665.
What is the Total Immigrants from Eastern Europe in Syracuse, NY?
Total Immigrants from Eastern Europe in Syracuse is 956.
What is the Total Immigrants from Eastern Europe in New York?
Total Immigrants from Eastern Europe in New York is 372,407.
What is the Total Immigrants from Eastern Europe in the United States?
Total Immigrants from Eastern Europe in the United States is 2,208,794.