Zip Codes with the Highest Percentage of Population Taking Public Transit to Work in Stony Brook, NY
RELATED REPORTS & OPTIONS
Public Transit
Stony Brook
Compare Zip Codes
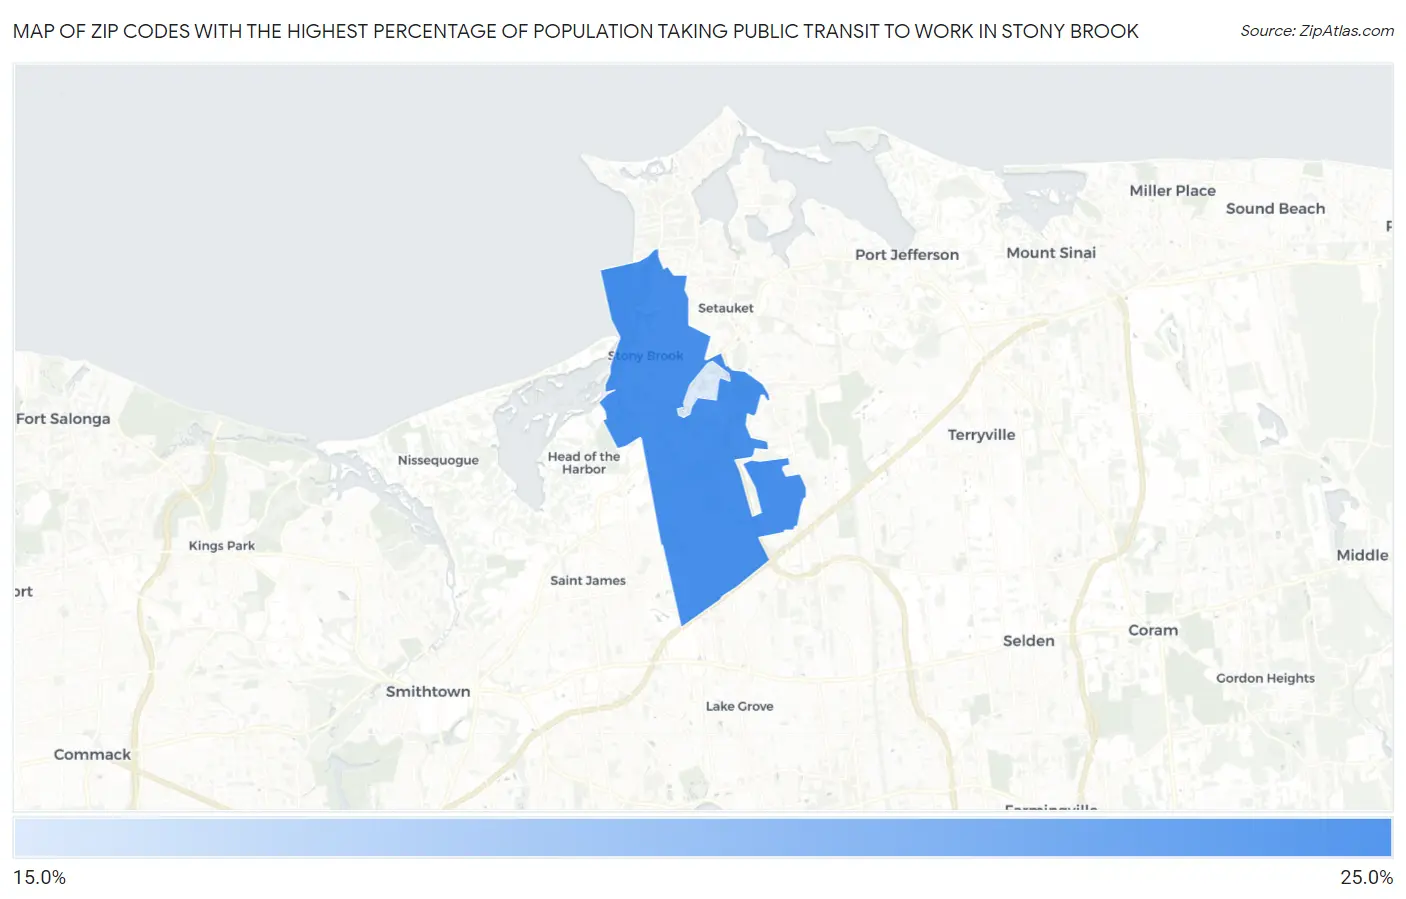
Map of Zip Codes with the Highest Percentage of Population Taking Public Transit to Work in Stony Brook
19.7%
25.0%
Zip Codes with the Highest Percentage of Population Taking Public Transit to Work in Stony Brook, NY
| Zip Code | % Public Transit | vs State | vs National | |
| 1. | 11790 | 25.0% | 39.6%(-14.6)#658 | 38.5%(-13.5)#7,576 |
| 2. | 11794 | 19.7% | 39.6%(-19.9)#685 | 38.5%(-18.8)#8,081 |
1
Common Questions
What are the Top Zip Codes with the Highest Percentage of Population Taking Public Transit to Work in Stony Brook, NY?
Top Zip Codes with the Highest Percentage of Population Taking Public Transit to Work in Stony Brook, NY are:
What zip code has the Highest Percentage of Population Taking Public Transit to Work in Stony Brook, NY?
11790 has the Highest Percentage of Population Taking Public Transit to Work in Stony Brook, NY with 25.0%.
What is the Percentage of Population Taking Public Transit to Work in Stony Brook, NY?
Percentage of Population Taking Public Transit to Work in Stony Brook is 27.9%.
What is the Percentage of Population Taking Public Transit to Work in New York?
Percentage of Population Taking Public Transit to Work in New York is 39.6%.
What is the Percentage of Population Taking Public Transit to Work in the United States?
Percentage of Population Taking Public Transit to Work in the United States is 38.5%.